Fig. 13
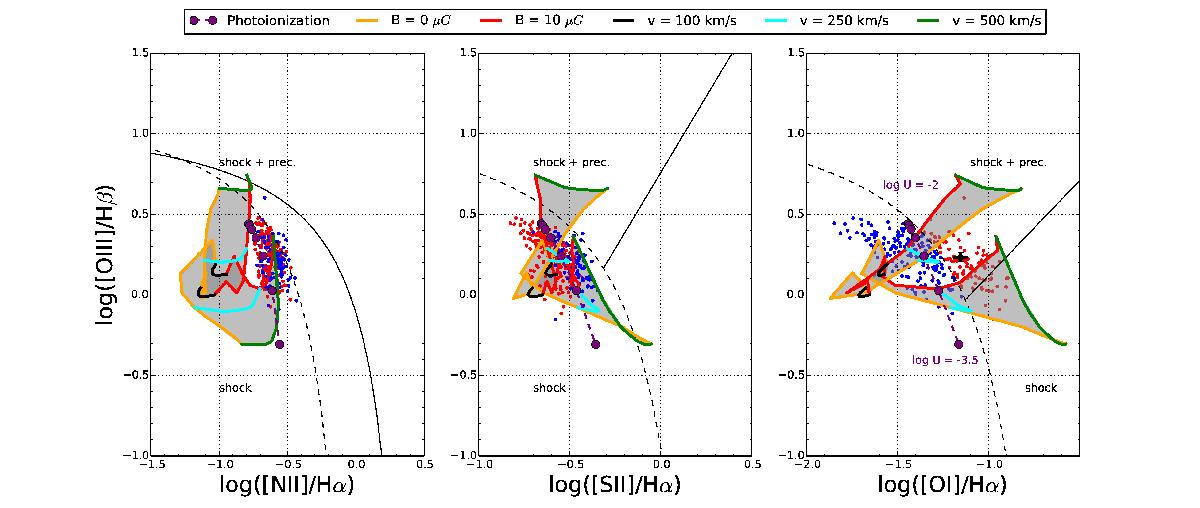
Shock models on the BPT diagrams. Only points with detected [OI] emission are plotted. The blue (resp. red) points lie in (resp. out of) the star formation locus on the [OI]/Hα BPT diagram. The purple dashed line is the ionization model prediction from MAPPINGS V, using a metallicity Z = 0.5 Z⊙ and log(P/k) = 5.2. The ionization parameter goes from log U = −2 to log U = −3.5, as indicated in the third diagram. The two grids come from the MAPPINGS III model for fast shock, as described in the text, and are drawn for shock only and shock + precursor.
Current usage metrics show cumulative count of Article Views (full-text article views including HTML views, PDF and ePub downloads, according to the available data) and Abstracts Views on Vision4Press platform.
Data correspond to usage on the plateform after 2015. The current usage metrics is available 48-96 hours after online publication and is updated daily on week days.
Initial download of the metrics may take a while.