Fig. 10
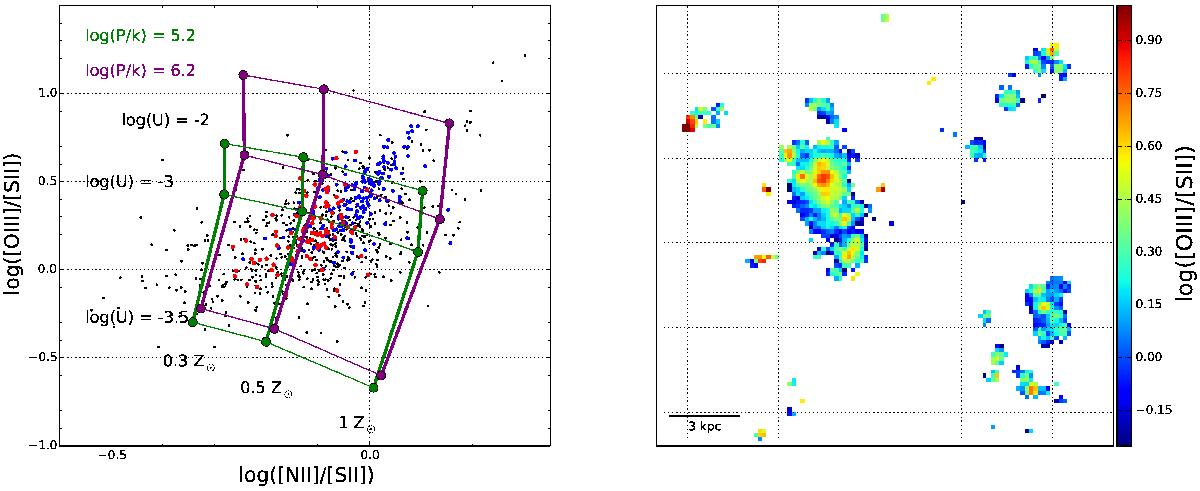
Left: metallicity-ionization parameter grid from the MAPPINGS V ionization model. The red points are the ones falling outside of the SF region in the third BPT diagram. The thick lines represent the grid for a constant metallicity and the thin lines for a constant ionizing parameter. The dimensionless ionizing parameter goes from log(U) = −3.5 to log(U) = −2. Right: spatial distribution of the logarithmic values of the [OIII]/[SII] ratio, used as a proxy for the ionization parameter. We see an outside-in gradient showing that the most ionized regions are located in the centre of the galaxy. The field of view is the same as in Fig. 3.
Current usage metrics show cumulative count of Article Views (full-text article views including HTML views, PDF and ePub downloads, according to the available data) and Abstracts Views on Vision4Press platform.
Data correspond to usage on the plateform after 2015. The current usage metrics is available 48-96 hours after online publication and is updated daily on week days.
Initial download of the metrics may take a while.