Free Access
Fig. 7
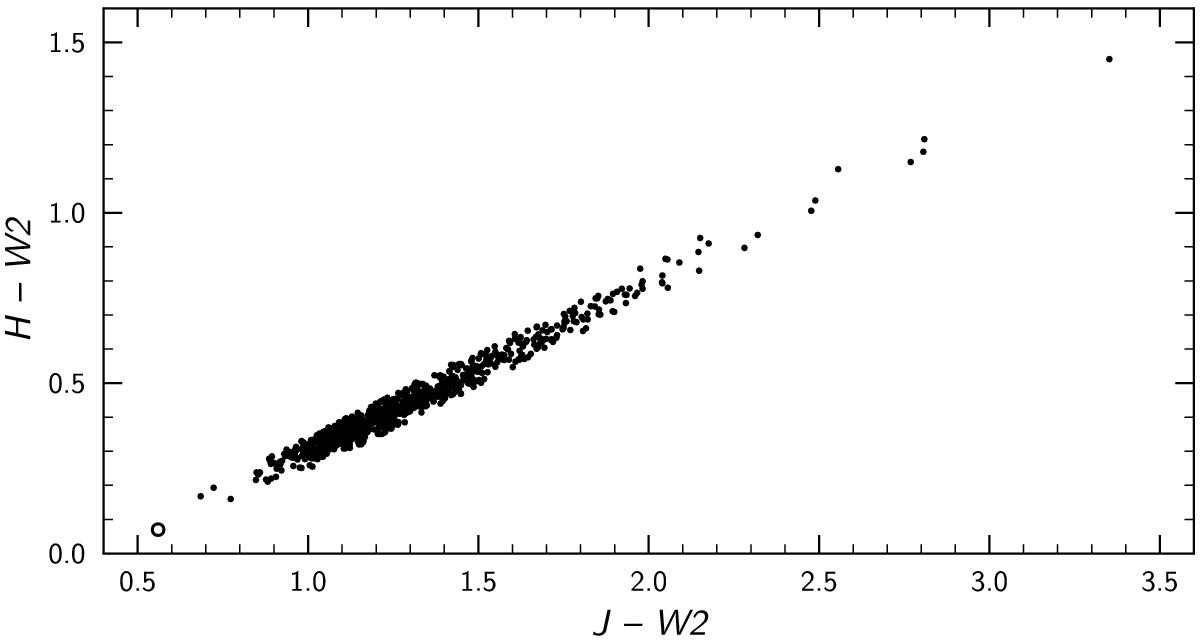
H−W2 vs. J−W2 diagram for the investigated H994 P1 area. The stars from the RCG+RGB belt in the J−H vs. H−Ks diagram with the 2MASS and WISE magnitude errors ≤0.03 mag are plotted.
Current usage metrics show cumulative count of Article Views (full-text article views including HTML views, PDF and ePub downloads, according to the available data) and Abstracts Views on Vision4Press platform.
Data correspond to usage on the plateform after 2015. The current usage metrics is available 48-96 hours after online publication and is updated daily on week days.
Initial download of the metrics may take a while.