Fig. 5
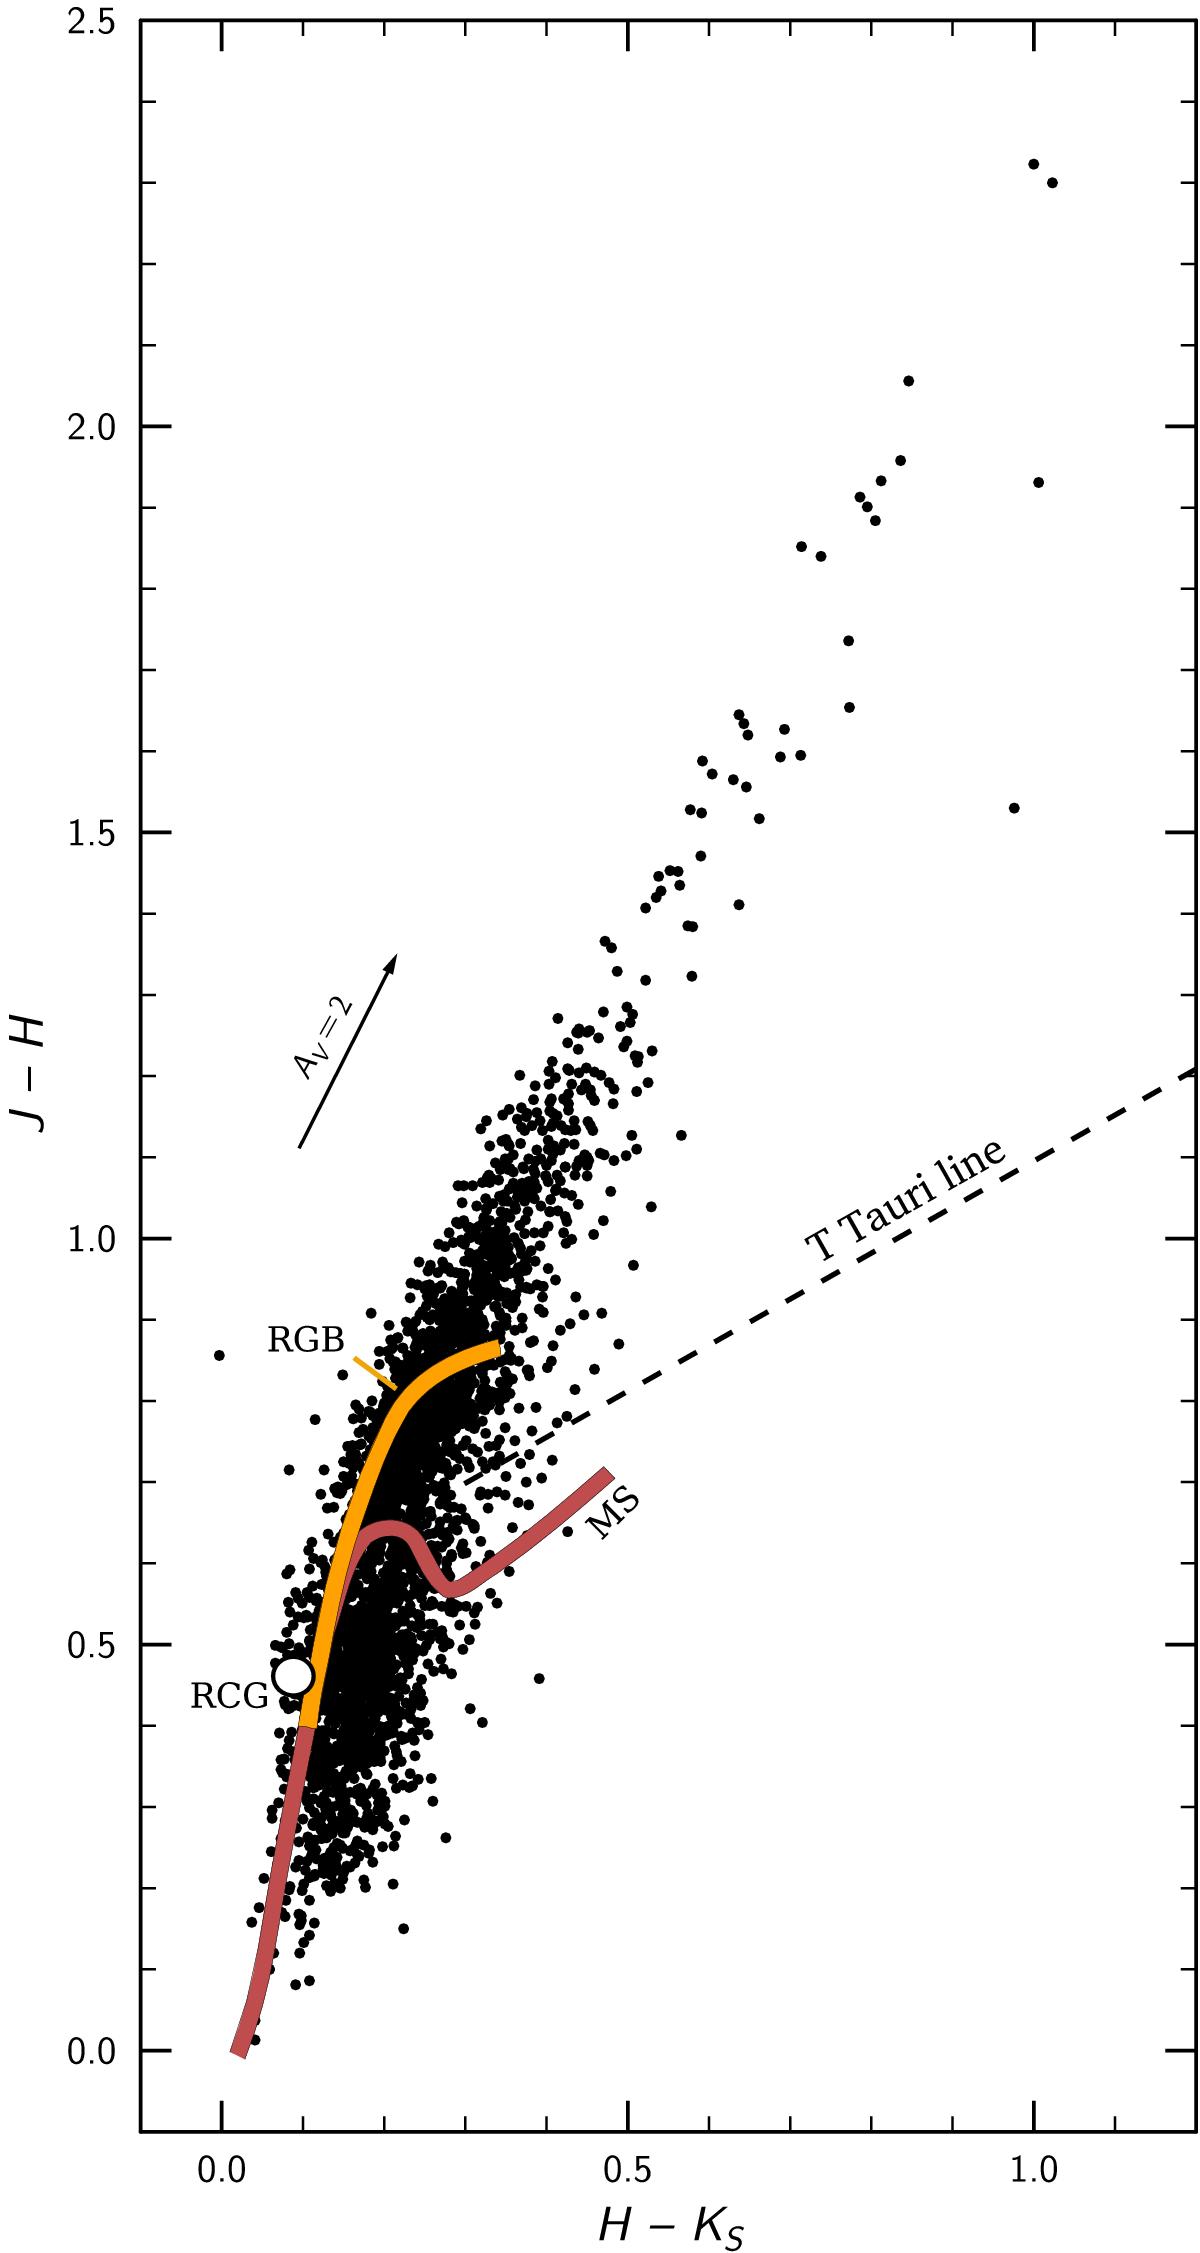
J−H vs. H−Ks diagram for 3230 stars in investigated TGU H994 P1 area. Only stars with the magnitude errors ≤0.03 mag are plotted. The main sequence (MS, brown belt), the red giant branch (RGB, orange belt), the intrinsic locus of red clump giants (RCG, red circle), the intrinsic line of T Tauri stars (broken line) and the reddening line for AV = 2 mag are shown.
Current usage metrics show cumulative count of Article Views (full-text article views including HTML views, PDF and ePub downloads, according to the available data) and Abstracts Views on Vision4Press platform.
Data correspond to usage on the plateform after 2015. The current usage metrics is available 48-96 hours after online publication and is updated daily on week days.
Initial download of the metrics may take a while.