Fig. 2
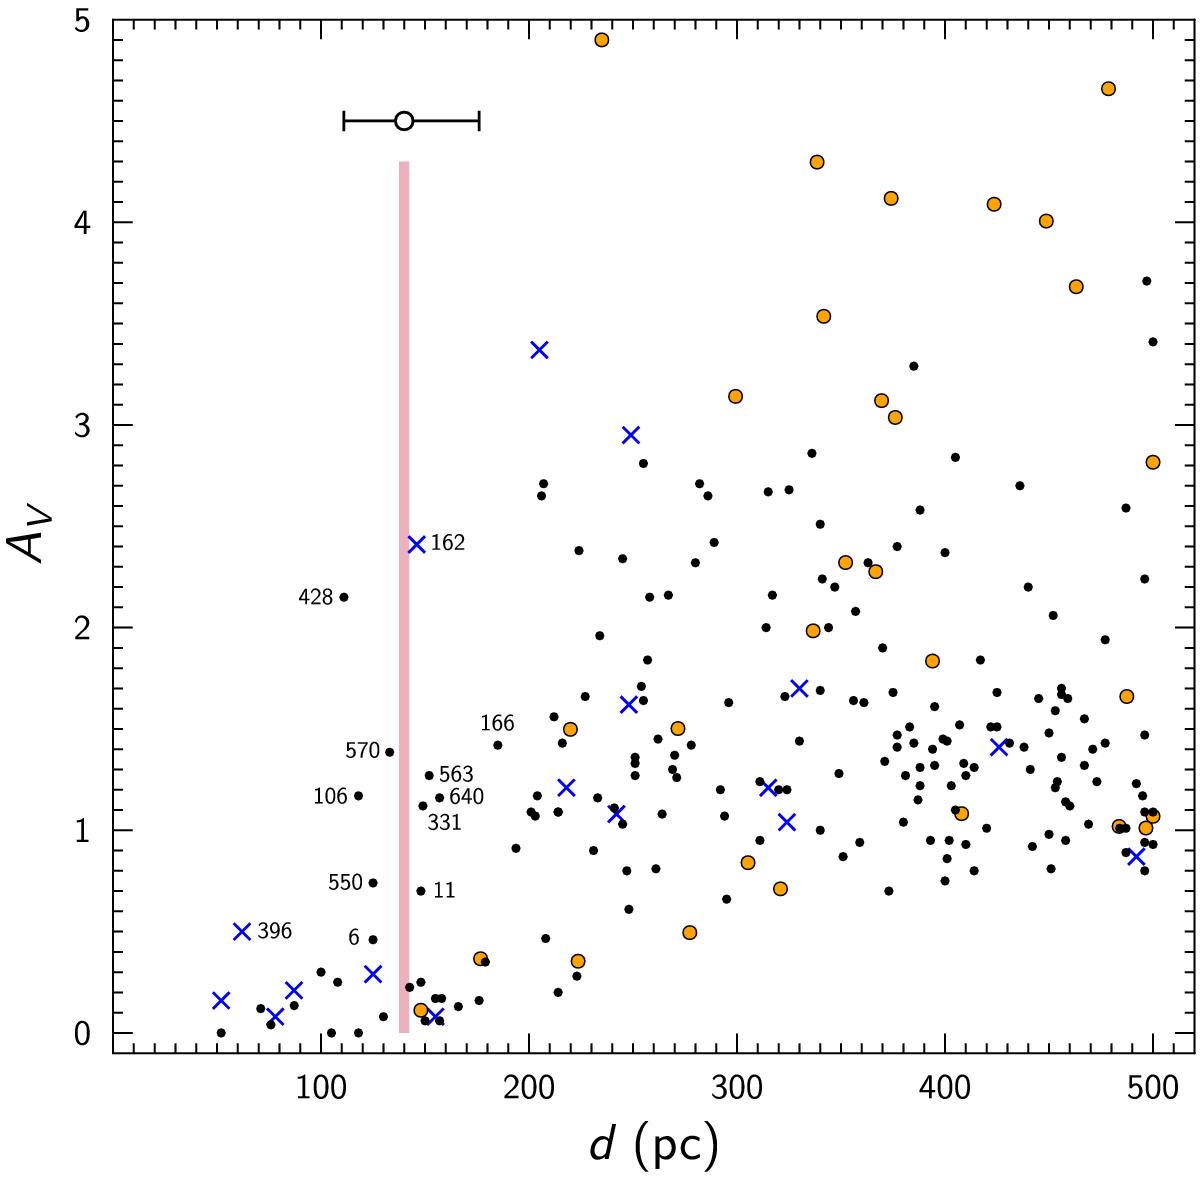
Dependence of the extinction on distance for the investigated area up to d = 500 pc. The stars, measured in the Molėtai telescope exposures, are plotted as dots, and the stars, measured in the VATT exposures, are plotted as circles. Crosses are the stars for which MK spectral classes were determined from their Asiago spectra (Table 3). The nearest reddened stars are labelled with their numbers in the Paper I catalogue. The red vertical line designates the accepted position of the dust cloud TGU H994 P1 at 140 pc (see the text). The 3σ error bar for this distance is shown.
Current usage metrics show cumulative count of Article Views (full-text article views including HTML views, PDF and ePub downloads, according to the available data) and Abstracts Views on Vision4Press platform.
Data correspond to usage on the plateform after 2015. The current usage metrics is available 48-96 hours after online publication and is updated daily on week days.
Initial download of the metrics may take a while.