Fig. 8
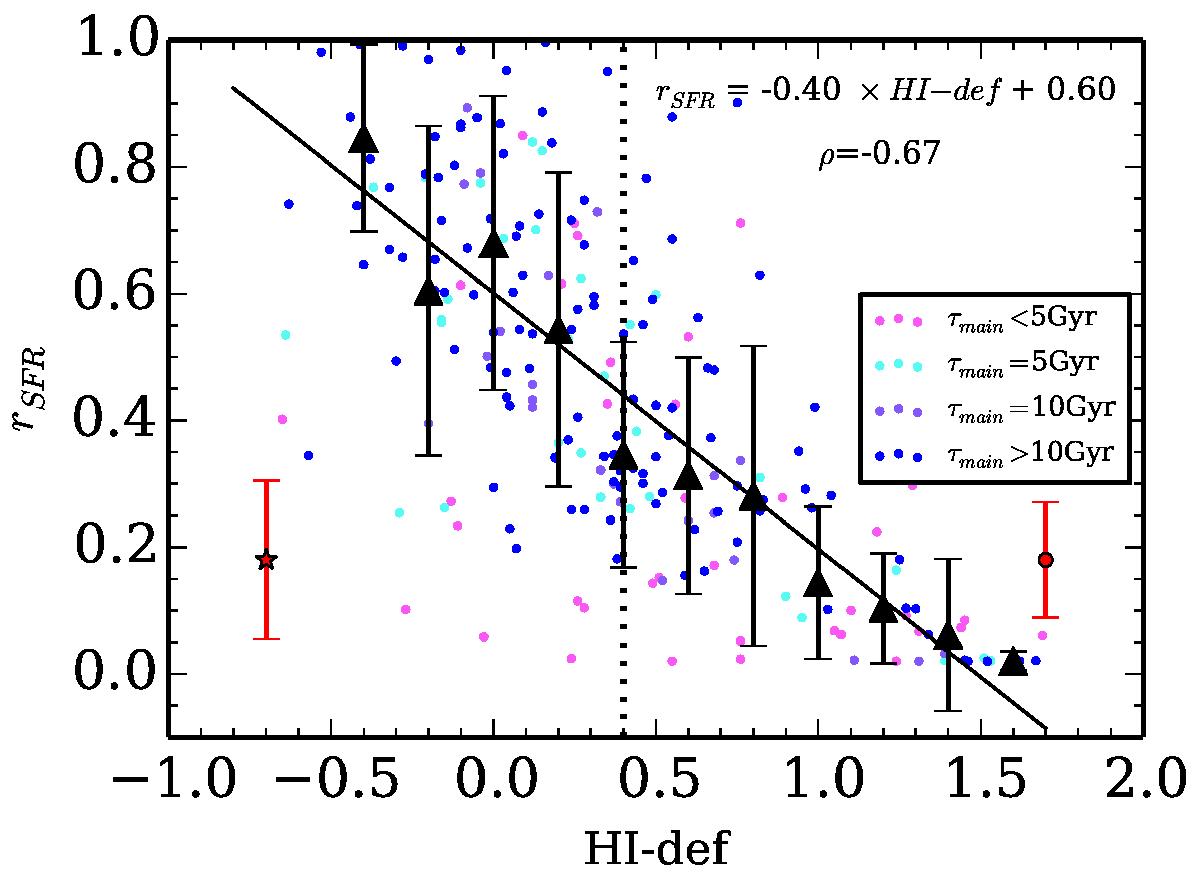
Relation between rSFR and the Hi deficiency. Data points are color-coded according to the value of τmain obtained from the fit. The mean errors bars for each subsample are provided with the red star for the normal galaxy sample and with the red filled circle for the deficient galaxies. The Spearman correlation coefficient ρ of the relation is indicated. Black triangles are the median values in bins of ΔHi−def= 0.2, and the error bars are the standard deviation of the points in each bins. The black filled line is the best linear fit to the data. The black dotted line indicates the adopted threshold used to separate normal from deficient galaxies.
Current usage metrics show cumulative count of Article Views (full-text article views including HTML views, PDF and ePub downloads, according to the available data) and Abstracts Views on Vision4Press platform.
Data correspond to usage on the plateform after 2015. The current usage metrics is available 48-96 hours after online publication and is updated daily on week days.
Initial download of the metrics may take a while.