Free Access
Fig. 7
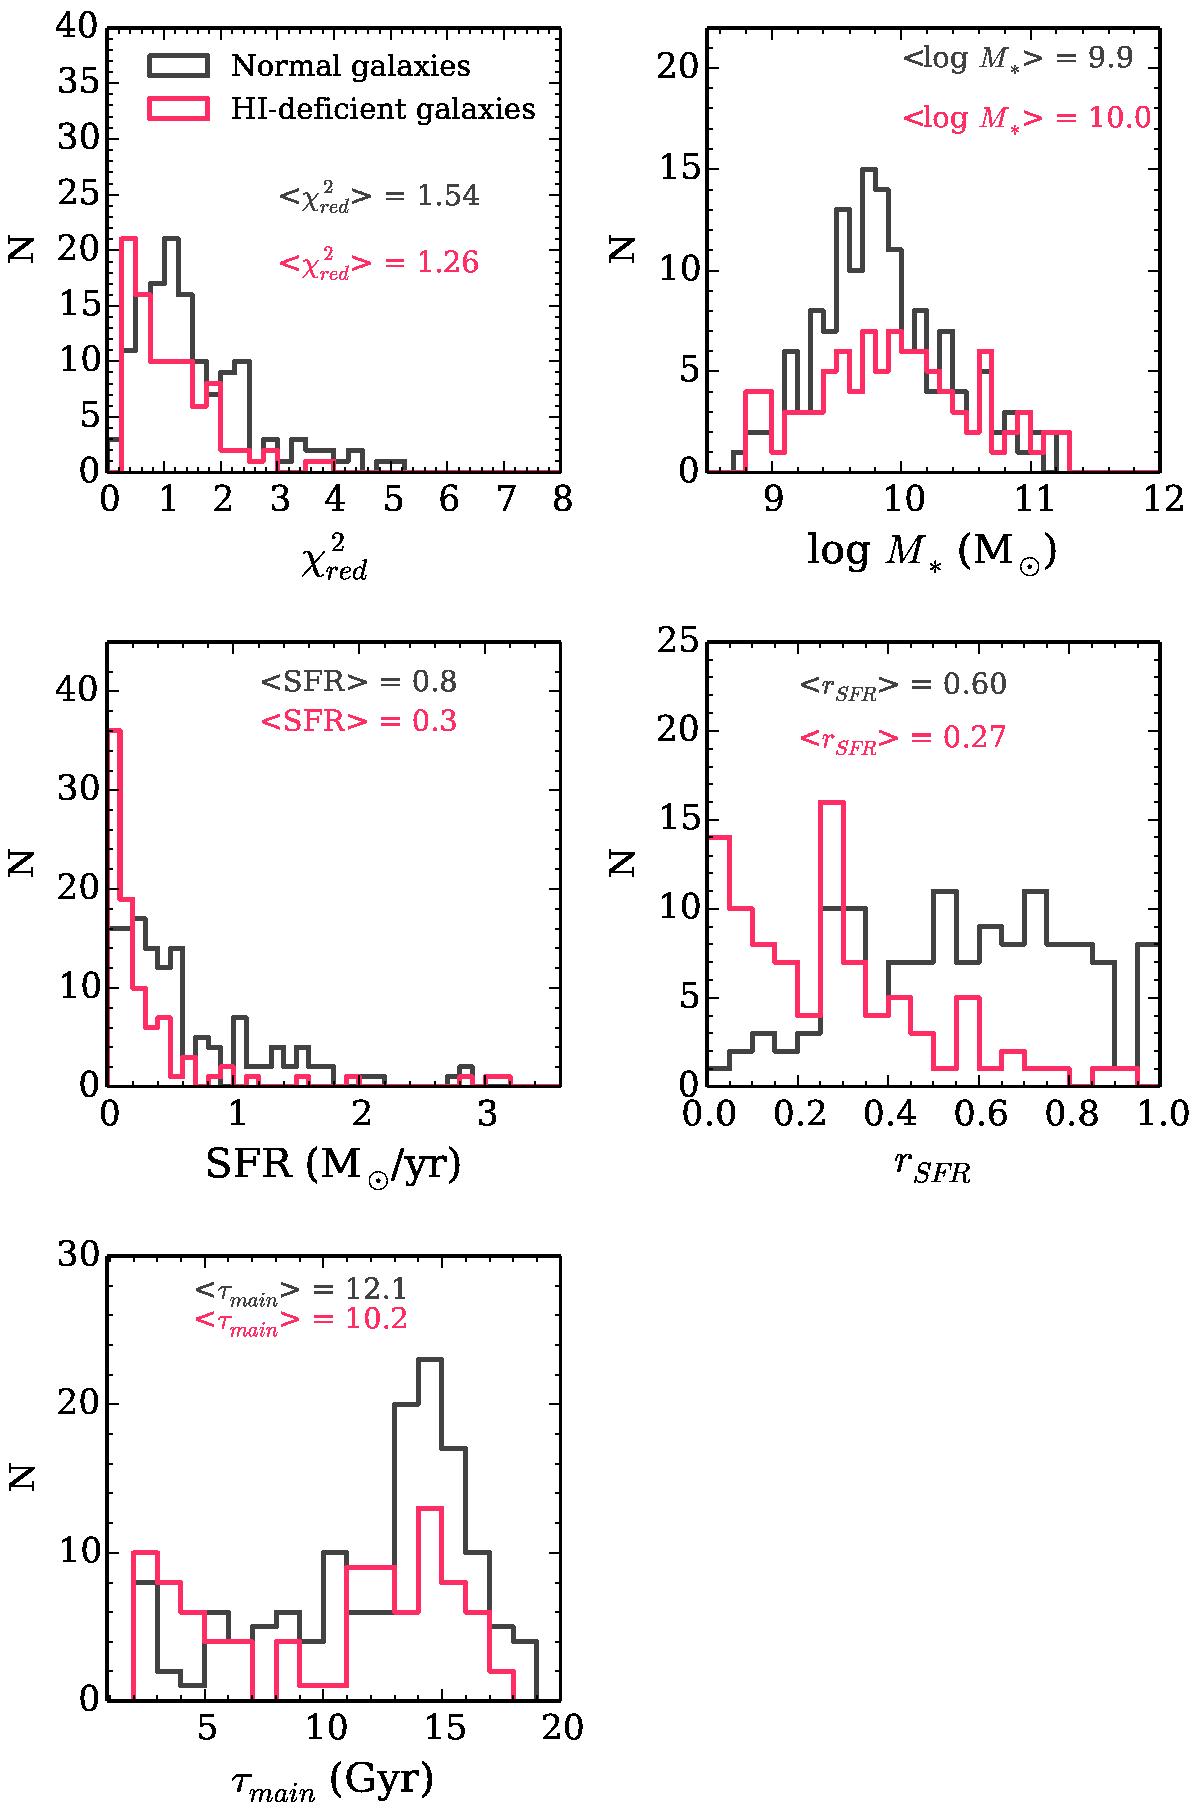
Distribution of the output parameters obtained from the SED fitting procedure with CIGALE. The results for the normal galaxy sample are shown in gray while the results for the Hi-deficient sample are shown in red.
Current usage metrics show cumulative count of Article Views (full-text article views including HTML views, PDF and ePub downloads, according to the available data) and Abstracts Views on Vision4Press platform.
Data correspond to usage on the plateform after 2015. The current usage metrics is available 48-96 hours after online publication and is updated daily on week days.
Initial download of the metrics may take a while.