Fig. 6
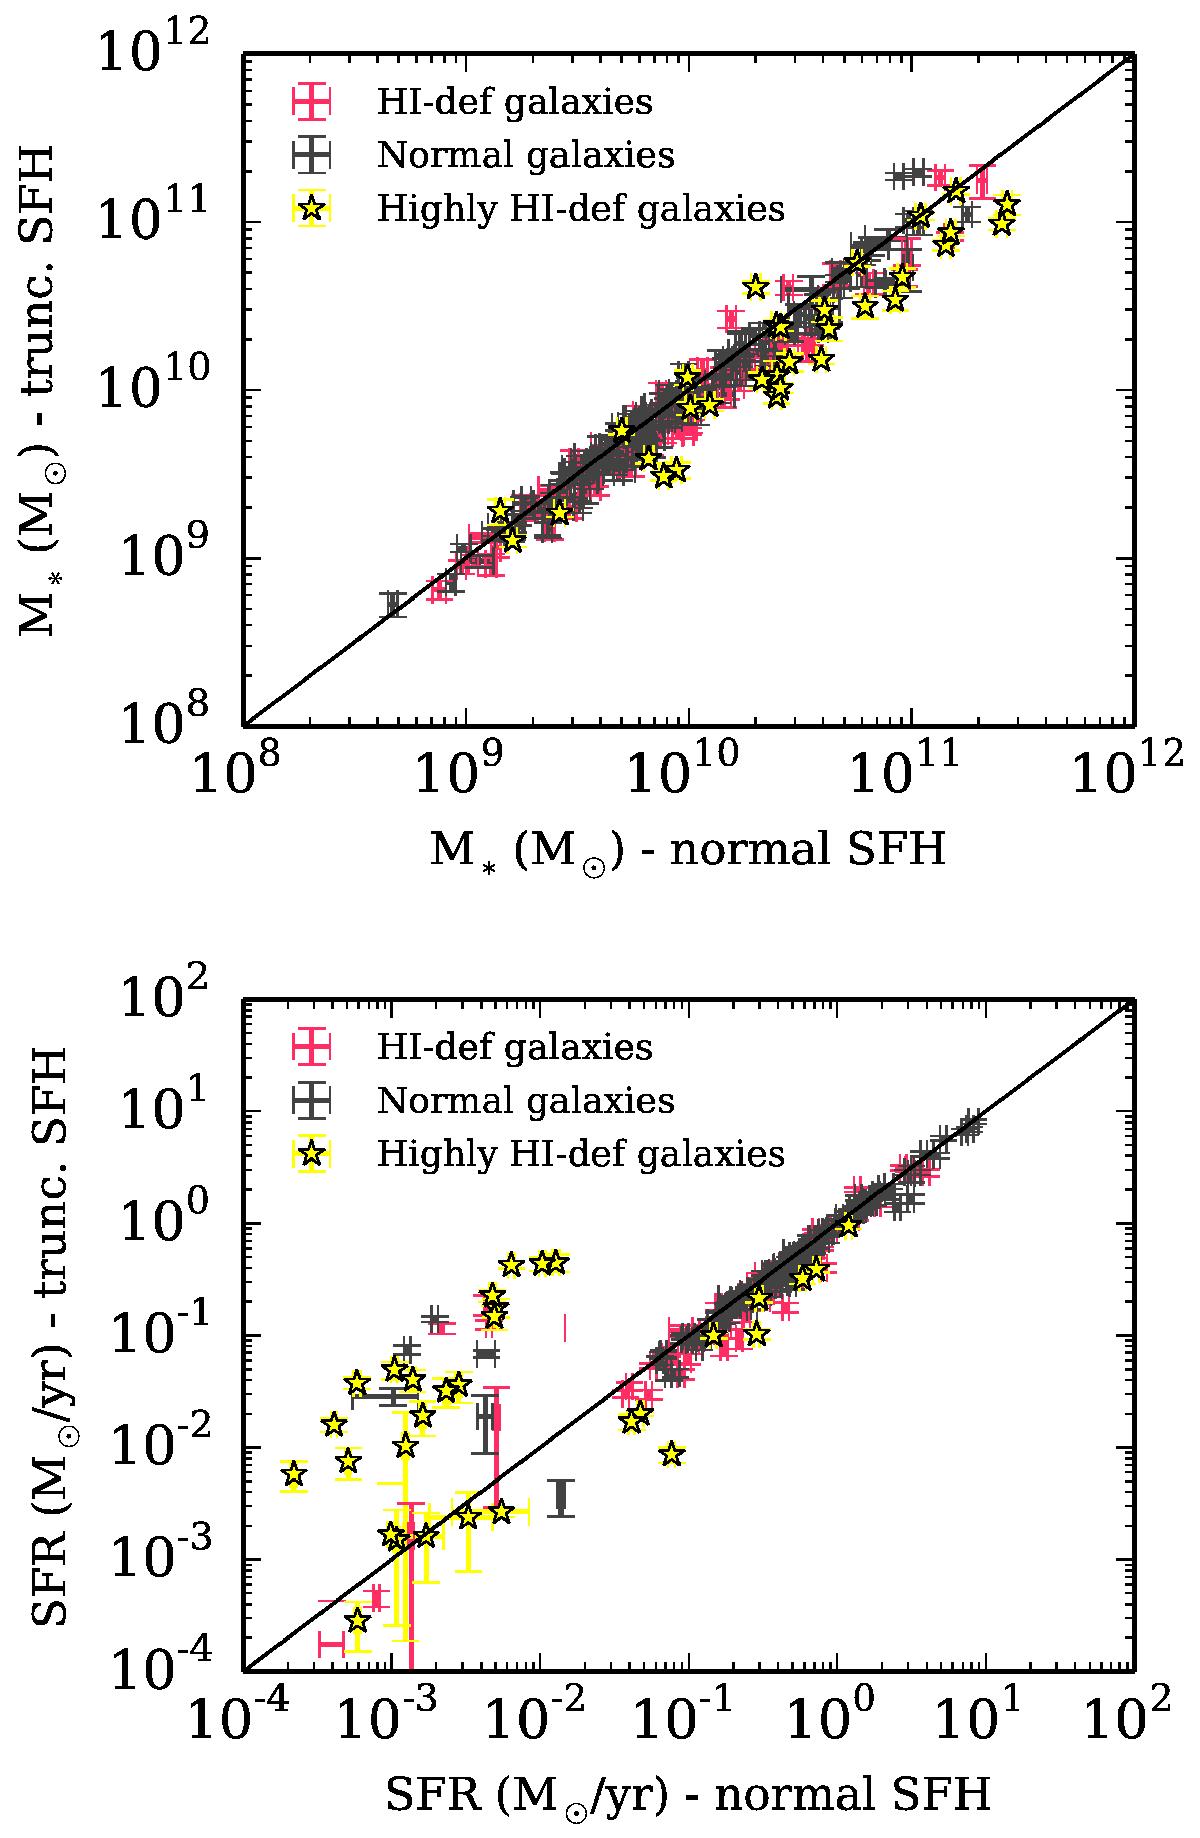
Comparison between the stellar masses (top panel) and SFR (bottom panel) obtained using the truncated and normally delayed SFH. Normal galaxies are shown in gray, whereas Hi-deficient and highly deficient galaxies (with Hi−def≥ 1) are shown in red and yellow, respectively. The black solid lines represent the one-to-one relationship.
Current usage metrics show cumulative count of Article Views (full-text article views including HTML views, PDF and ePub downloads, according to the available data) and Abstracts Views on Vision4Press platform.
Data correspond to usage on the plateform after 2015. The current usage metrics is available 48-96 hours after online publication and is updated daily on week days.
Initial download of the metrics may take a while.