Fig. 4
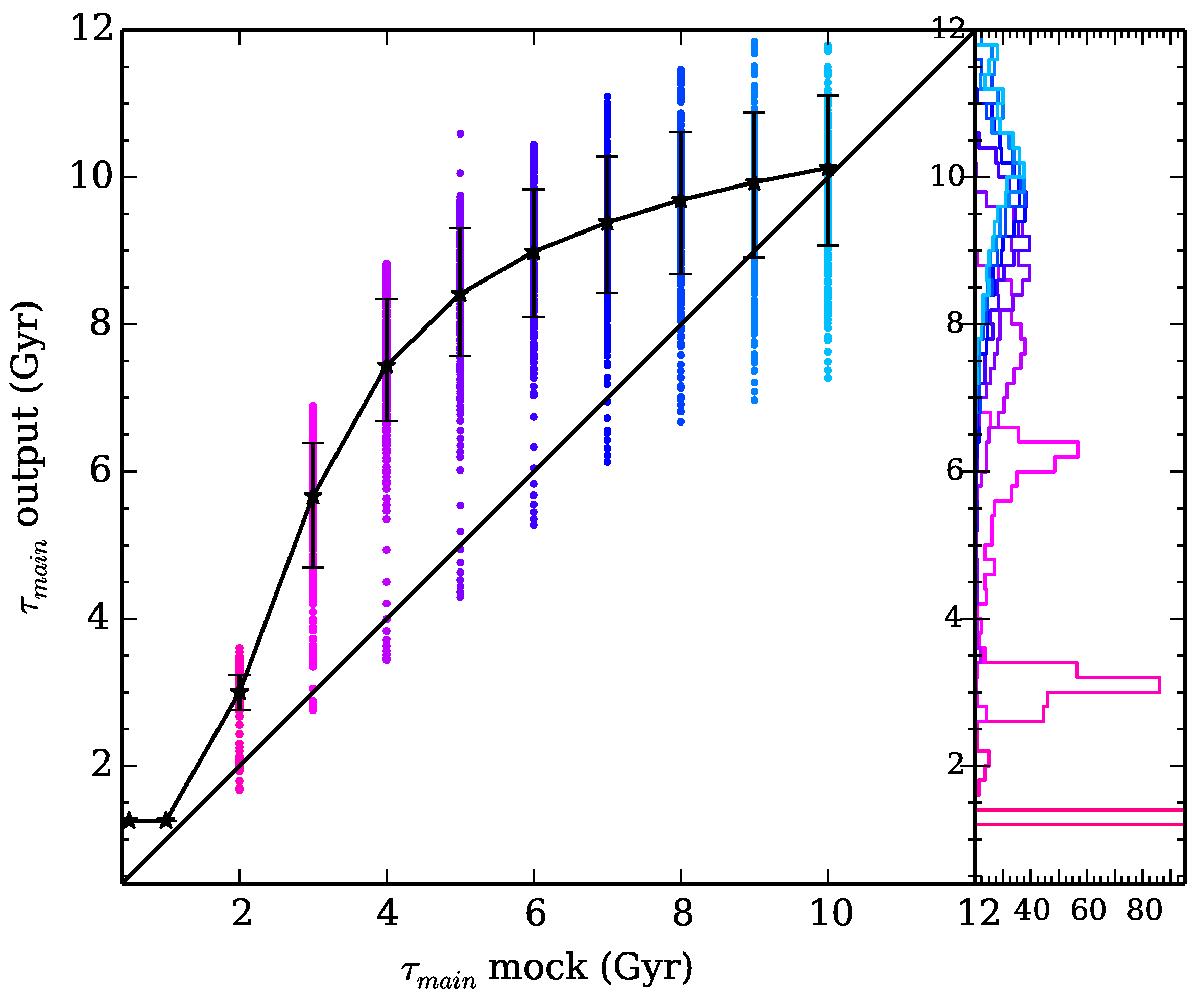
Constraints on τmain as a result of the mock catalog analysis of the truncated SFH parameters. The dispersion of the output values are shown in blue, the mean and 64th percentile for each input values in black. The black solid line is the one-to-one relationship. The right panel shows the distribution of the points for each input value of τmain.
Current usage metrics show cumulative count of Article Views (full-text article views including HTML views, PDF and ePub downloads, according to the available data) and Abstracts Views on Vision4Press platform.
Data correspond to usage on the plateform after 2015. The current usage metrics is available 48-96 hours after online publication and is updated daily on week days.
Initial download of the metrics may take a while.