Fig. 12
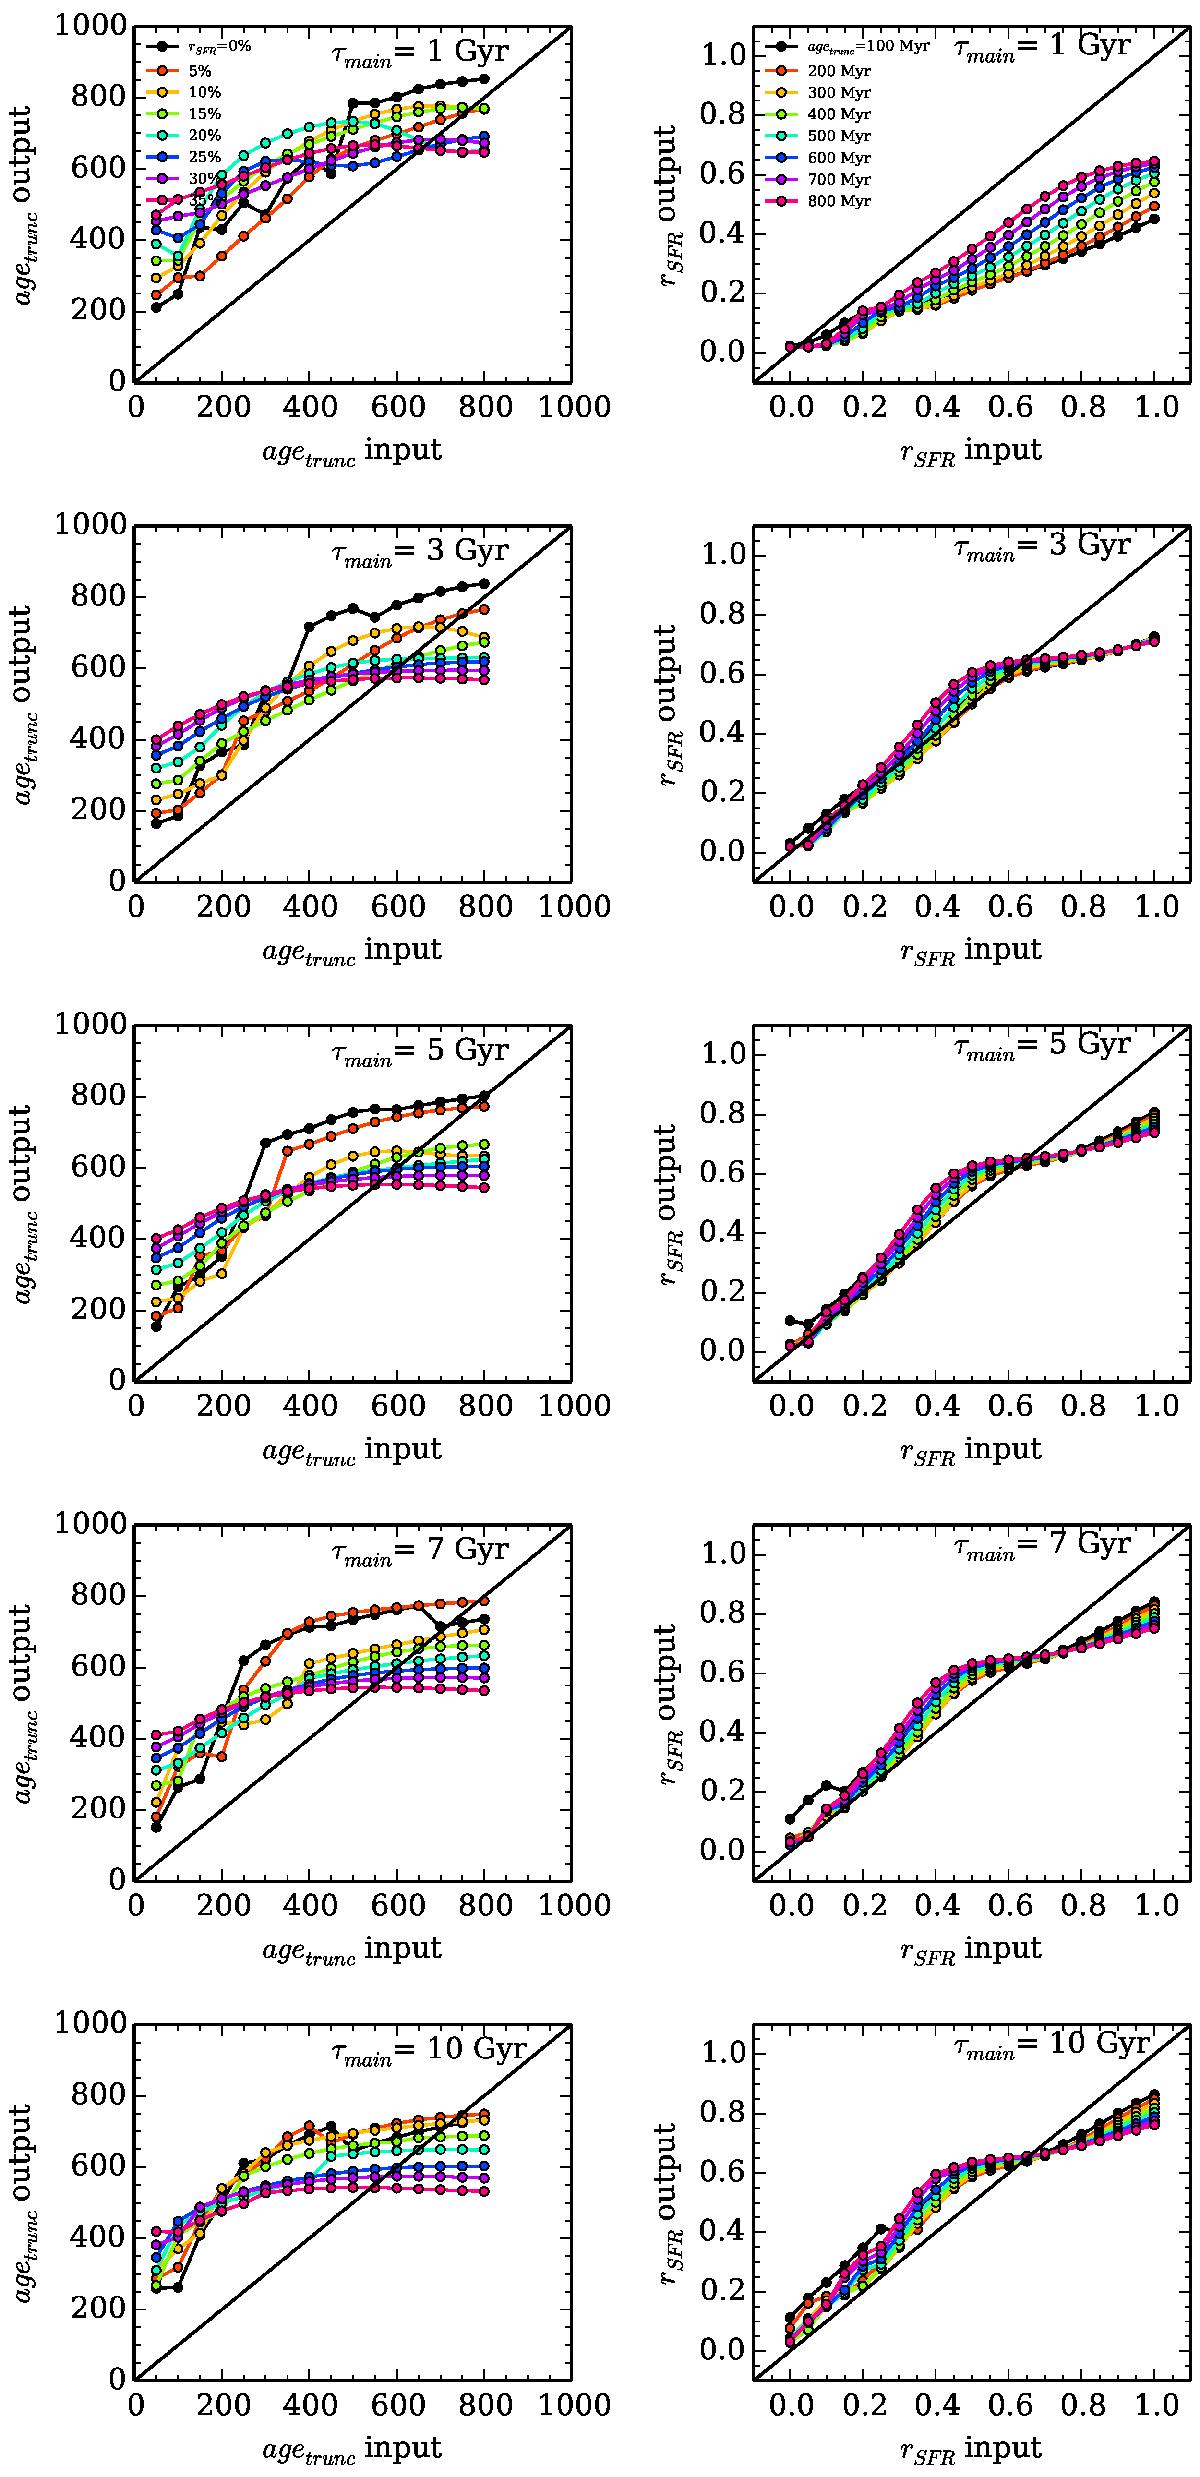
Results of the z = 2 mock catalog analysis for the two parameters agetrunc and rSFR. The five left panels present the constraint on agetrunc for five different τmain (1, 3, 5, 7, and 10 Gyr). The colored lines corresponds to different values of rSFR. The five righthand panels display the constraint on rSFR for the same five values of τmain (1, 3, 5, 7, and 10 Gyr), the colored lines corresponding to different agetrunc. On each panel, the black solid line is the one-to-one relationship.
Current usage metrics show cumulative count of Article Views (full-text article views including HTML views, PDF and ePub downloads, according to the available data) and Abstracts Views on Vision4Press platform.
Data correspond to usage on the plateform after 2015. The current usage metrics is available 48-96 hours after online publication and is updated daily on week days.
Initial download of the metrics may take a while.