Fig. 11
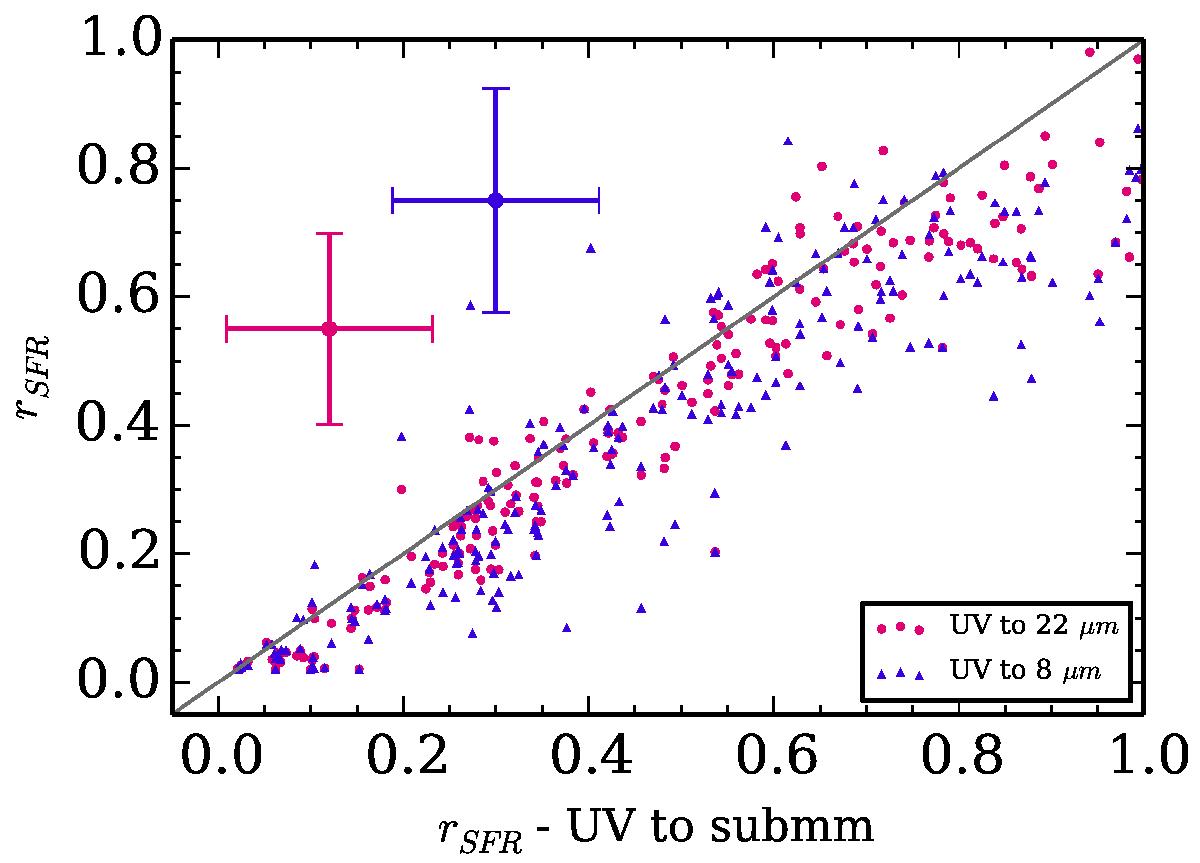
Impact of the photometric coverage on the derivation of the rSFR parameter. Pink points show the relation between the values obtained when the photometric coverage stops at 22 μm and the values obtained from a full coverage. The purple points show the relation when the photometric coverage stops at 8 μm. Mean error bars are shown for both subsets.
Current usage metrics show cumulative count of Article Views (full-text article views including HTML views, PDF and ePub downloads, according to the available data) and Abstracts Views on Vision4Press platform.
Data correspond to usage on the plateform after 2015. The current usage metrics is available 48-96 hours after online publication and is updated daily on week days.
Initial download of the metrics may take a while.