Free Access
Fig. 10
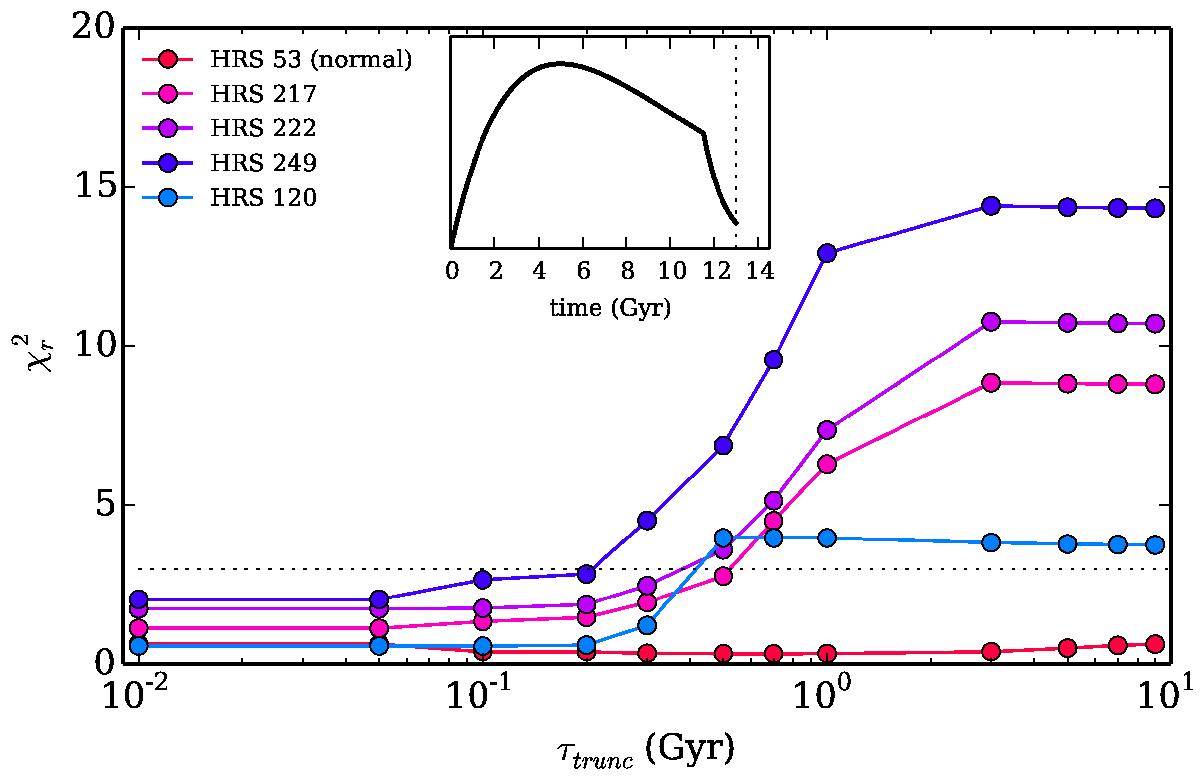
Variations in the χ2 as a function of τtrunc for the five galaxies presented in Fig. 2. The horizontal dotted line shows a χ2 of 3 below which fits are usually considered as good. The insert panel shows the shape of the SFH considered in this test.
Current usage metrics show cumulative count of Article Views (full-text article views including HTML views, PDF and ePub downloads, according to the available data) and Abstracts Views on Vision4Press platform.
Data correspond to usage on the plateform after 2015. The current usage metrics is available 48-96 hours after online publication and is updated daily on week days.
Initial download of the metrics may take a while.