Fig. 6
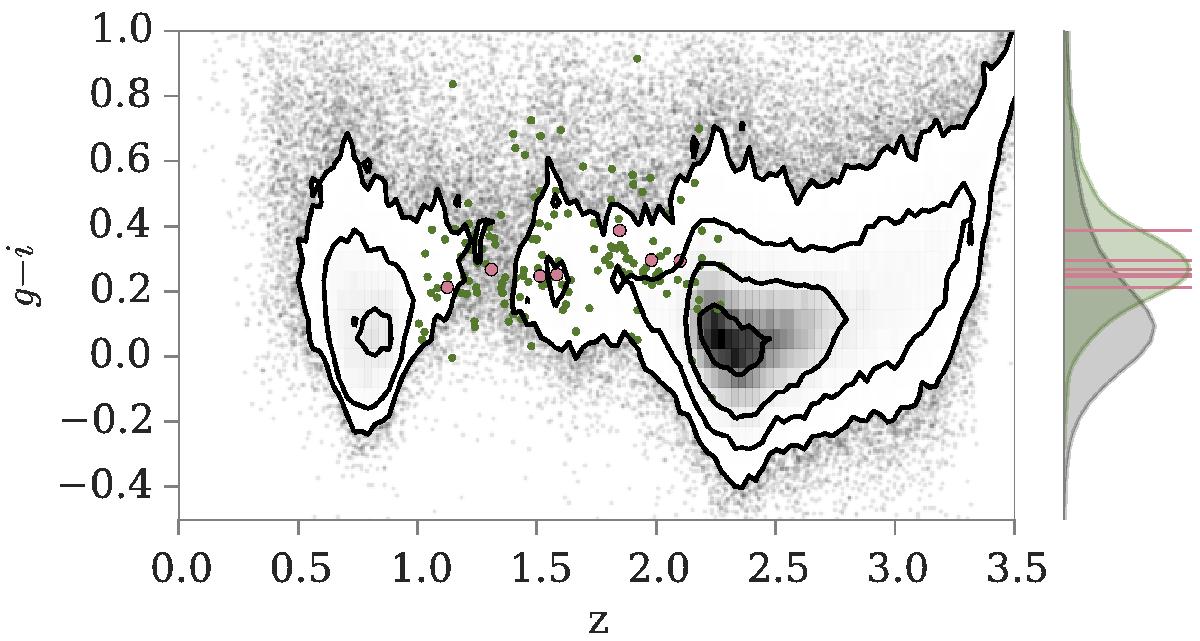
Quasar color, g−i, as a function of redshift, z. The full quasar sample from SDSS DR10 (Pâris et al. 2014) is shown in gray color. Bounding contours show the 0.5, 1, 1.5, 2σ contours of the density of points. The olive points are individual quasars from the SDSS sample which satisfy r< = 17. Overplotted in pink are the quasars contributing to the composite presented here. The quasar colors have been marginalized over in the right side where the tall pink lines are at the position of the composite quasars and the olive shaded area is the kernel density estimation of the distribution of quasars fulfilling the selection criteria. The gray-shaded area is the projection of the DR10 quasar sample.
Current usage metrics show cumulative count of Article Views (full-text article views including HTML views, PDF and ePub downloads, according to the available data) and Abstracts Views on Vision4Press platform.
Data correspond to usage on the plateform after 2015. The current usage metrics is available 48-96 hours after online publication and is updated daily on week days.
Initial download of the metrics may take a while.