Fig. 4
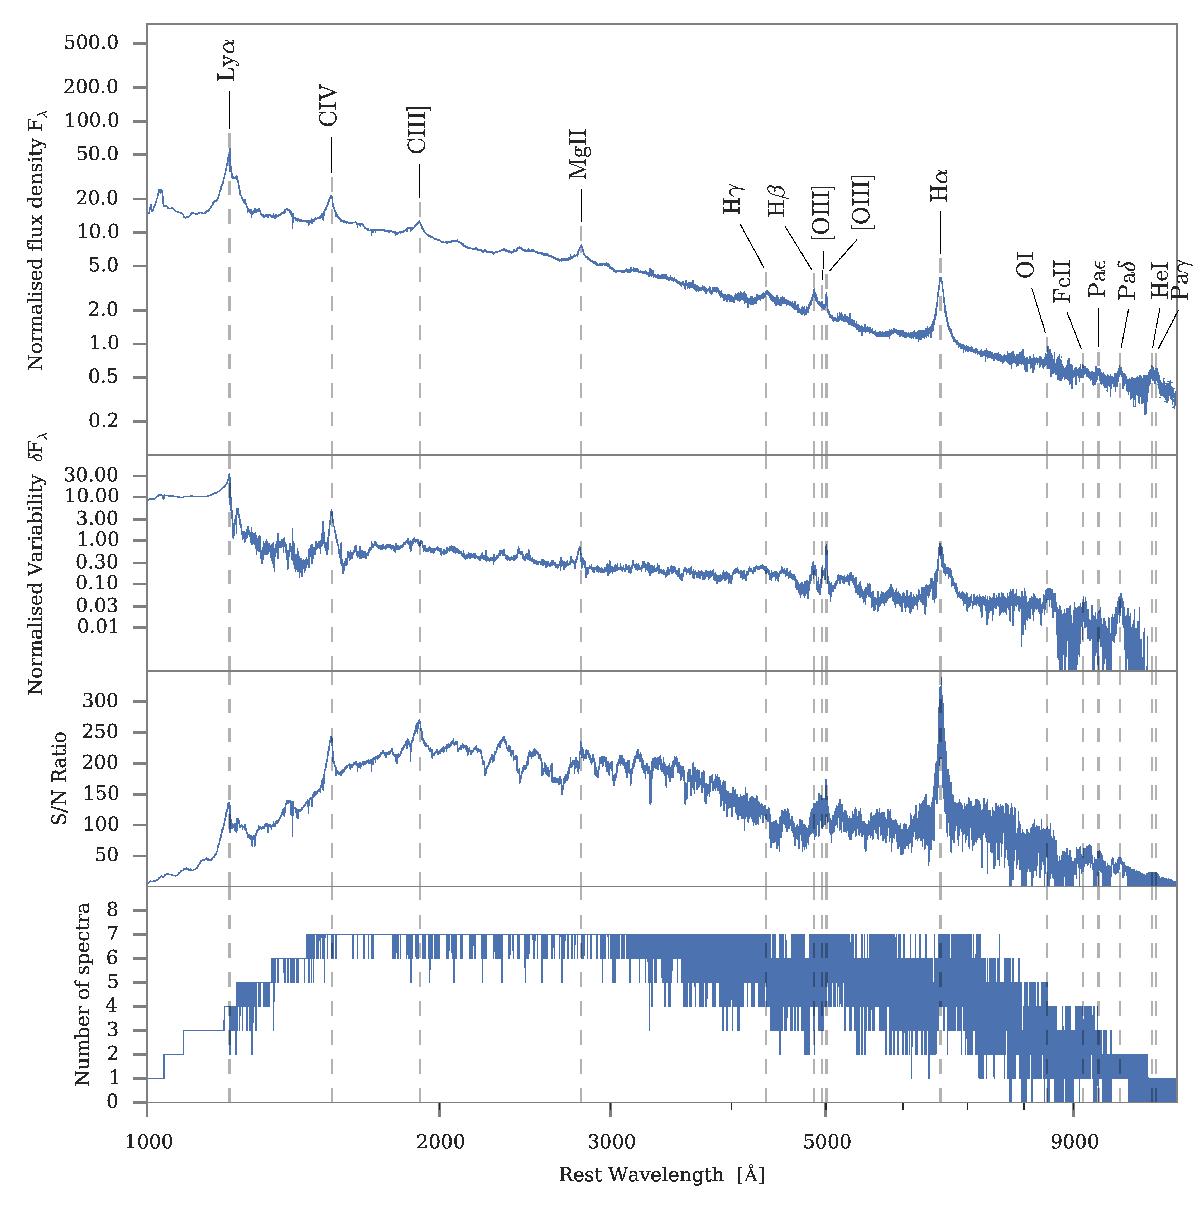
Top panel: composite spectrum with prominent emission lines marked. Upper middle panel: measure of intra-spectrum variability. The standard deviation of the constituent spectra as a function of wavelength, where to normalize the differing slopes between the different spectra, the fitted slope in each of the constituent spectra have been subtracted. Lower middle panel: signal-to-noise ratio. The composite spectrum is divided by the error spectrum, thus directly giving a measure of the signal strength. Bottom panel: number of contributing spectra as a function of wavelength.
Current usage metrics show cumulative count of Article Views (full-text article views including HTML views, PDF and ePub downloads, according to the available data) and Abstracts Views on Vision4Press platform.
Data correspond to usage on the plateform after 2015. The current usage metrics is available 48-96 hours after online publication and is updated daily on week days.
Initial download of the metrics may take a while.