Fig. 1
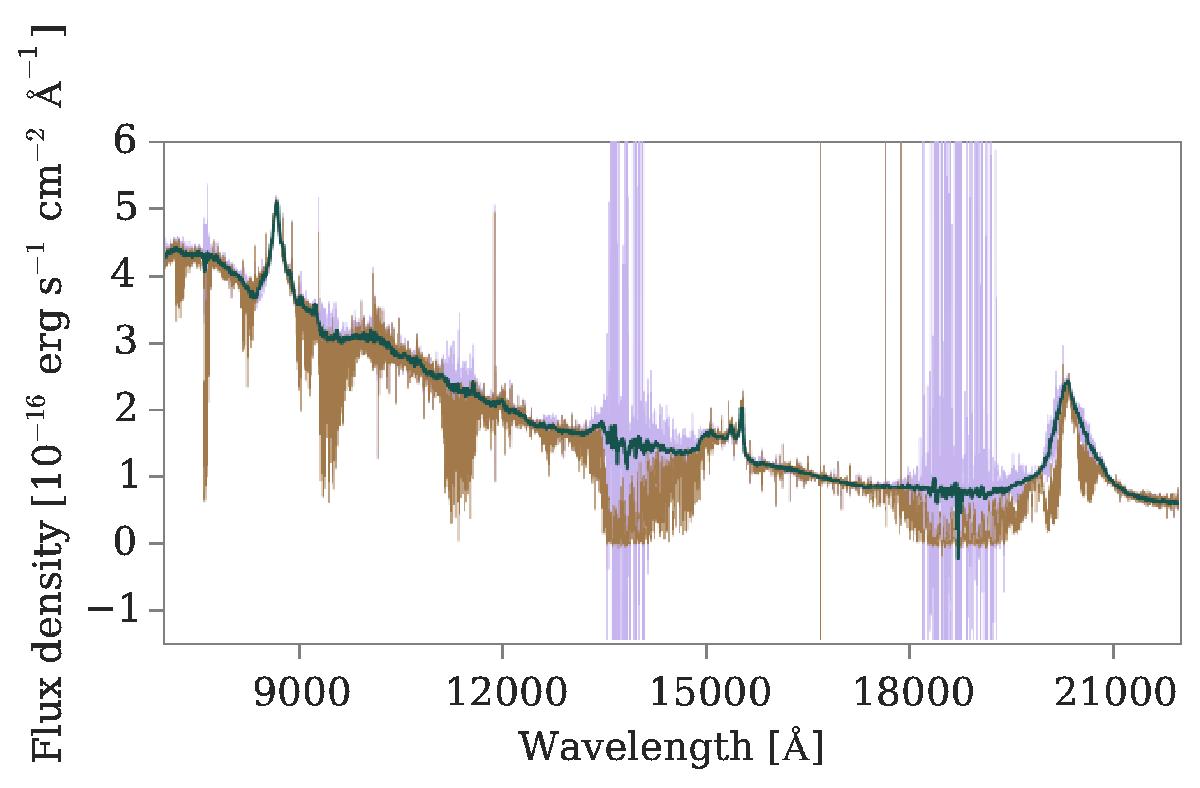
Telluric correction for quasar SDSS1431+0535 where brown is the uncorrected spectrum and purple is the corrected spectrum and teal is the corrected spectrum smoothed by 50 pixels. The regions of pure noise are where the atmospheric transmission is ~zero, thus only leaving noise after correction. Residuals after correction are visible. The noise image is corrected correspondingly and regions severely affected are down-weighted in the weighted combination.
Current usage metrics show cumulative count of Article Views (full-text article views including HTML views, PDF and ePub downloads, according to the available data) and Abstracts Views on Vision4Press platform.
Data correspond to usage on the plateform after 2015. The current usage metrics is available 48-96 hours after online publication and is updated daily on week days.
Initial download of the metrics may take a while.