Free Access
Fig. 4
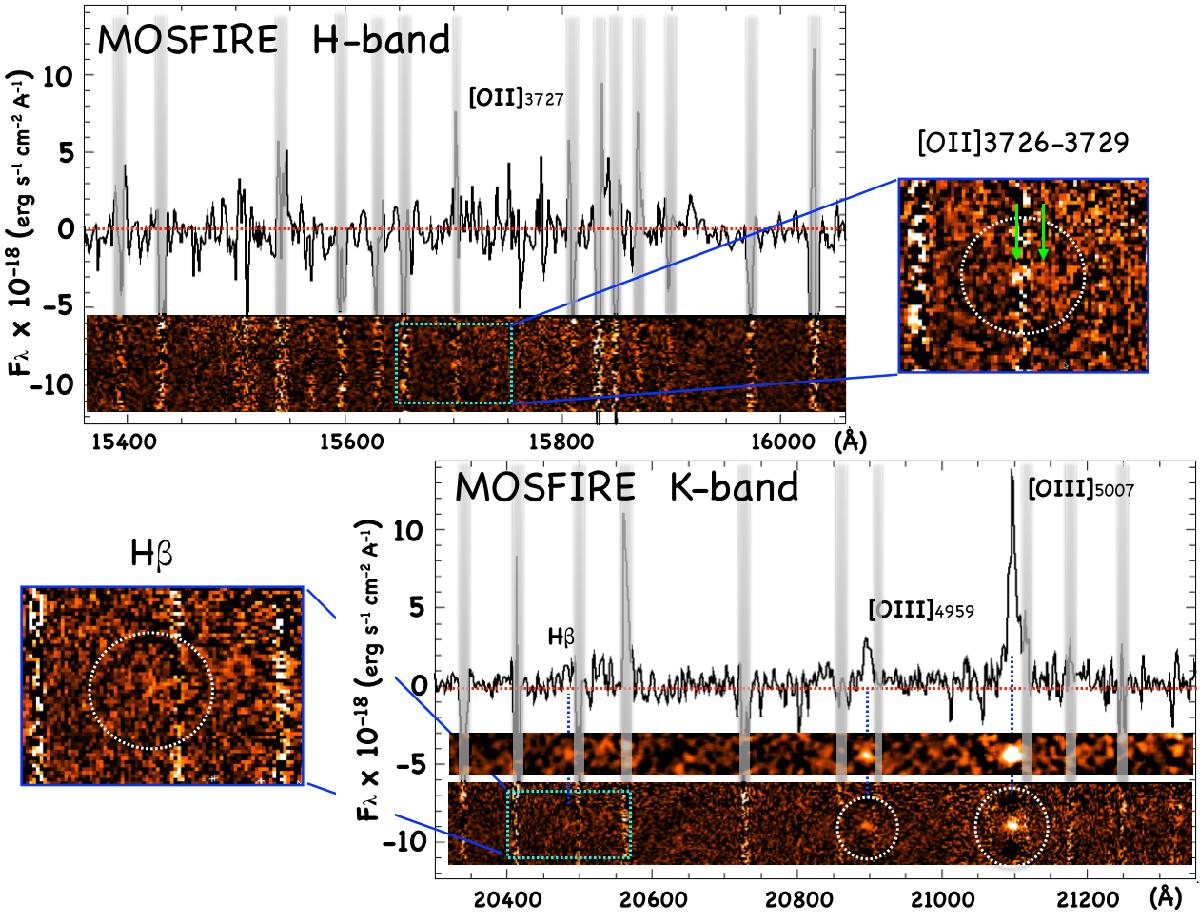
Two- and one-dimensional near-infrared spectra of Ion2 in the MOSFIRE H- and K-band. Two insets show the regions where Hβ and the [O ii]λ3727 doublet are expected from the redshift. The gray stripes in the one-dimensional spectra indicate the position of the sky lines.
Current usage metrics show cumulative count of Article Views (full-text article views including HTML views, PDF and ePub downloads, according to the available data) and Abstracts Views on Vision4Press platform.
Data correspond to usage on the plateform after 2015. The current usage metrics is available 48-96 hours after online publication and is updated daily on week days.
Initial download of the metrics may take a while.