Fig. 2
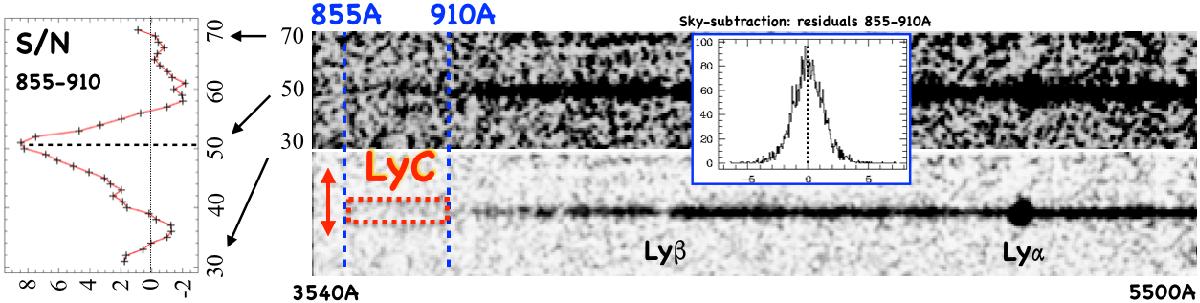
Two-dimensional LR VIMOS UV spectrum of Ion2 with different cuts to emphasize the spectral features Lyα and Lyβ (bottom) and the Lyman continuum λ< 912 Å, in the range 855–910 Å (top, vertical dotted blue lines). On the left, we show the moving average calculated within a rectangular aperture (855−910 Å × 1.25′′, red-dotted rectangle) in the spatial direction divided by its rms on the left side. A signal is detected at λ< 912 Å with S/N> 5. The inset shows the pixel distribution of the background after sky-subtraction in the region 855–910 Å (derived from the S/N spectrum). The distribution is symmetric (skewness = −0.016) with the mean and median close to zero, +0.0057 and −0.014, respectively. No significant systematic effects are present.
Current usage metrics show cumulative count of Article Views (full-text article views including HTML views, PDF and ePub downloads, according to the available data) and Abstracts Views on Vision4Press platform.
Data correspond to usage on the plateform after 2015. The current usage metrics is available 48-96 hours after online publication and is updated daily on week days.
Initial download of the metrics may take a while.