Fig. B.2
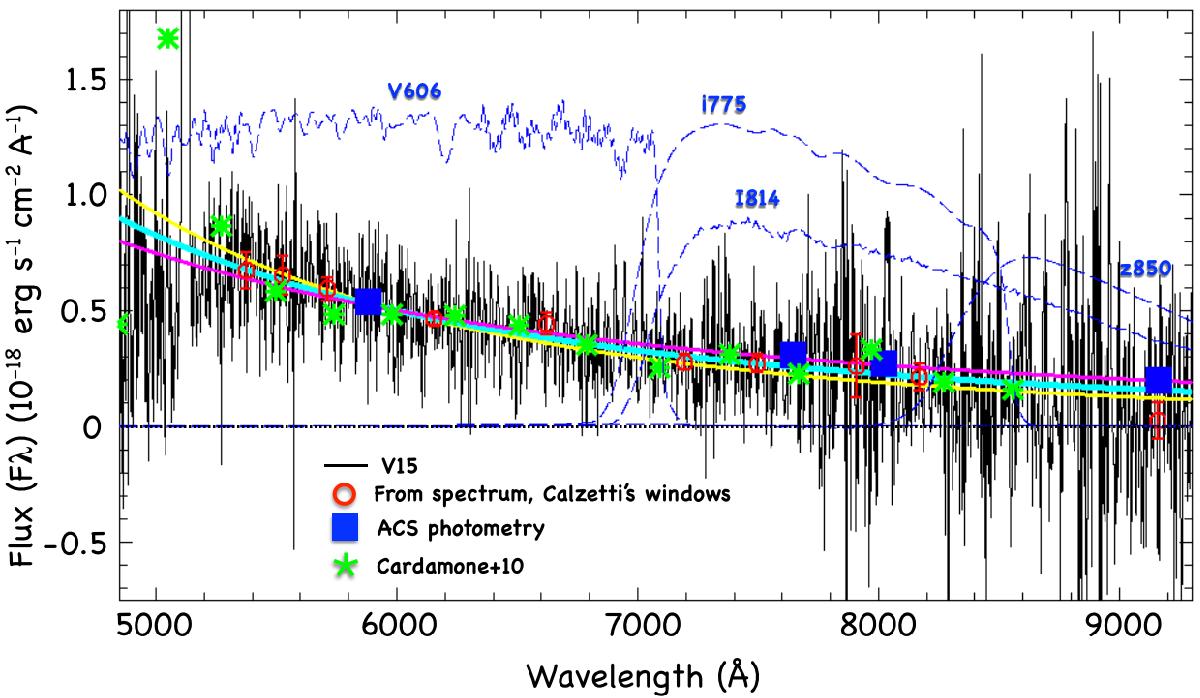
1D UV spectrum from V15 (black). ACS photometry (blue squares) is shown along with the corresponding transmission curves (V606, i775, I814, and z850, blue dashed lines). We also show the medium-band photometry from the MUSYC survey (green stars, Cardamone et al. 2010). The red dots and associated error bars show the flux derived through the wavelength windows used in Calzetti et al. (1994) to derive the UV β slope. The cyan line denotes the best fit over the Calzetti windows and the violet and yellow lines encompass the 68% uncertainty (β = −2.75, −3.40 and −2.20, respectively).
Current usage metrics show cumulative count of Article Views (full-text article views including HTML views, PDF and ePub downloads, according to the available data) and Abstracts Views on Vision4Press platform.
Data correspond to usage on the plateform after 2015. The current usage metrics is available 48-96 hours after online publication and is updated daily on week days.
Initial download of the metrics may take a while.