Free Access
Fig. 9
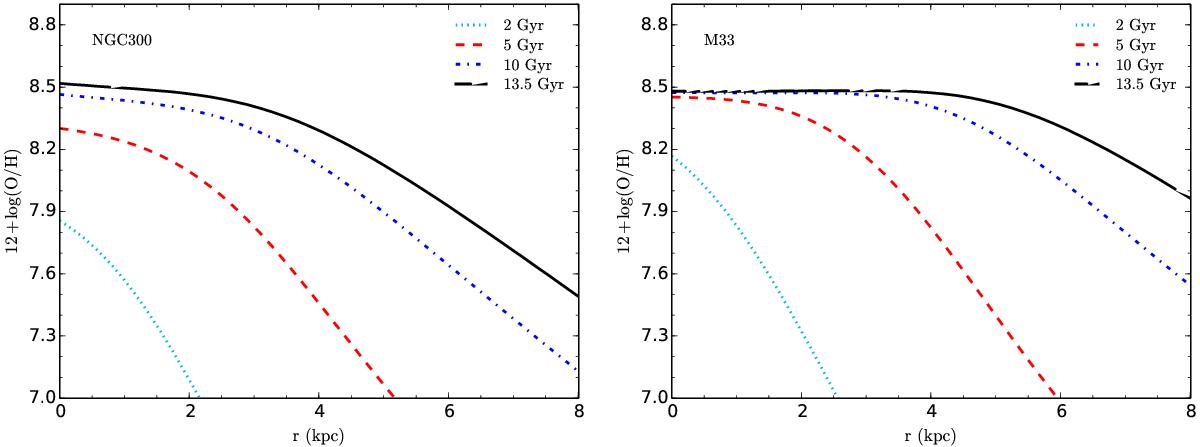
Time evolution of the radial profiles of 12 + log (O/H) for the disks of NGC 300 (left panel) and M 33 (right panel) predicted by their own best-fitting models. Different line types represent the radial profile of 12 + log (O/H) at 2 (dotted line), 5 (dashed line), 10 (dot-dashed line), and 13.5 Gyr (solid line).
This figure is made of several images, please see below:
Current usage metrics show cumulative count of Article Views (full-text article views including HTML views, PDF and ePub downloads, according to the available data) and Abstracts Views on Vision4Press platform.
Data correspond to usage on the plateform after 2015. The current usage metrics is available 48-96 hours after online publication and is updated daily on week days.
Initial download of the metrics may take a while.