Free Access
Fig. 3
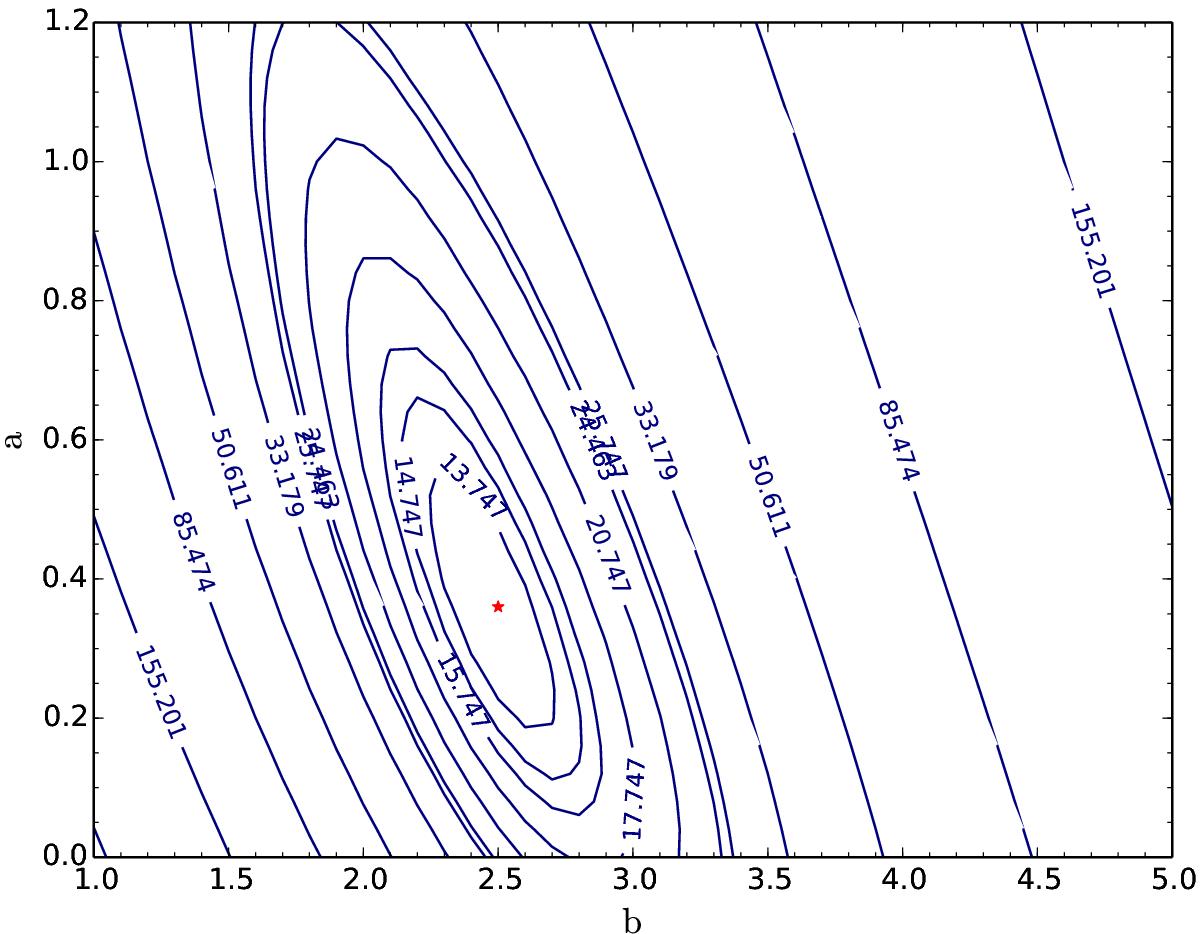
χ2 contours plot of a,b and bout determination. χ2 contours are calculated by allowing bout to vary to minimize χ2 for each pair of values of a and b. The number of each contour shows the value of χ2. The first, second, and third ellipses are contours, which correspond to 68%, 84%, and 92% confidence level, respectively.
Current usage metrics show cumulative count of Article Views (full-text article views including HTML views, PDF and ePub downloads, according to the available data) and Abstracts Views on Vision4Press platform.
Data correspond to usage on the plateform after 2015. The current usage metrics is available 48-96 hours after online publication and is updated daily on week days.
Initial download of the metrics may take a while.