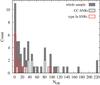
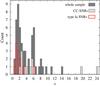
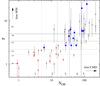
Fig. 9
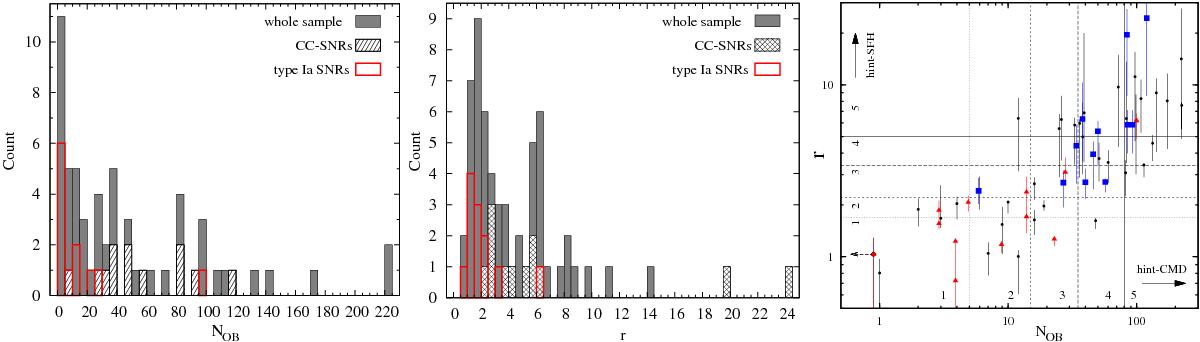
Left and middle panel: count distribution of LMC SNRs as function of NOB and r. The distribution for the SNRs with a secured CC classification is shown with the hatched boxes; that for type Ia SNRs is outlined in red. The whole sample is shown by the solid grey histograms. Right panel: r–NOB diagram of LMC SNRs. Secured Ia and CC SNRs are marked by red triangles and blue squares, respectively; the rest of the sample is shown with black dots. The arrow in the lower left corner indicates an SNR with NOB= 0. The regions corresponding to different “Hint-SFH” and “Hint-CMD” are marked by the gridding.
Current usage metrics show cumulative count of Article Views (full-text article views including HTML views, PDF and ePub downloads, according to the available data) and Abstracts Views on Vision4Press platform.
Data correspond to usage on the plateform after 2015. The current usage metrics is available 48-96 hours after online publication and is updated daily on week days.
Initial download of the metrics may take a while.