Fig. 6
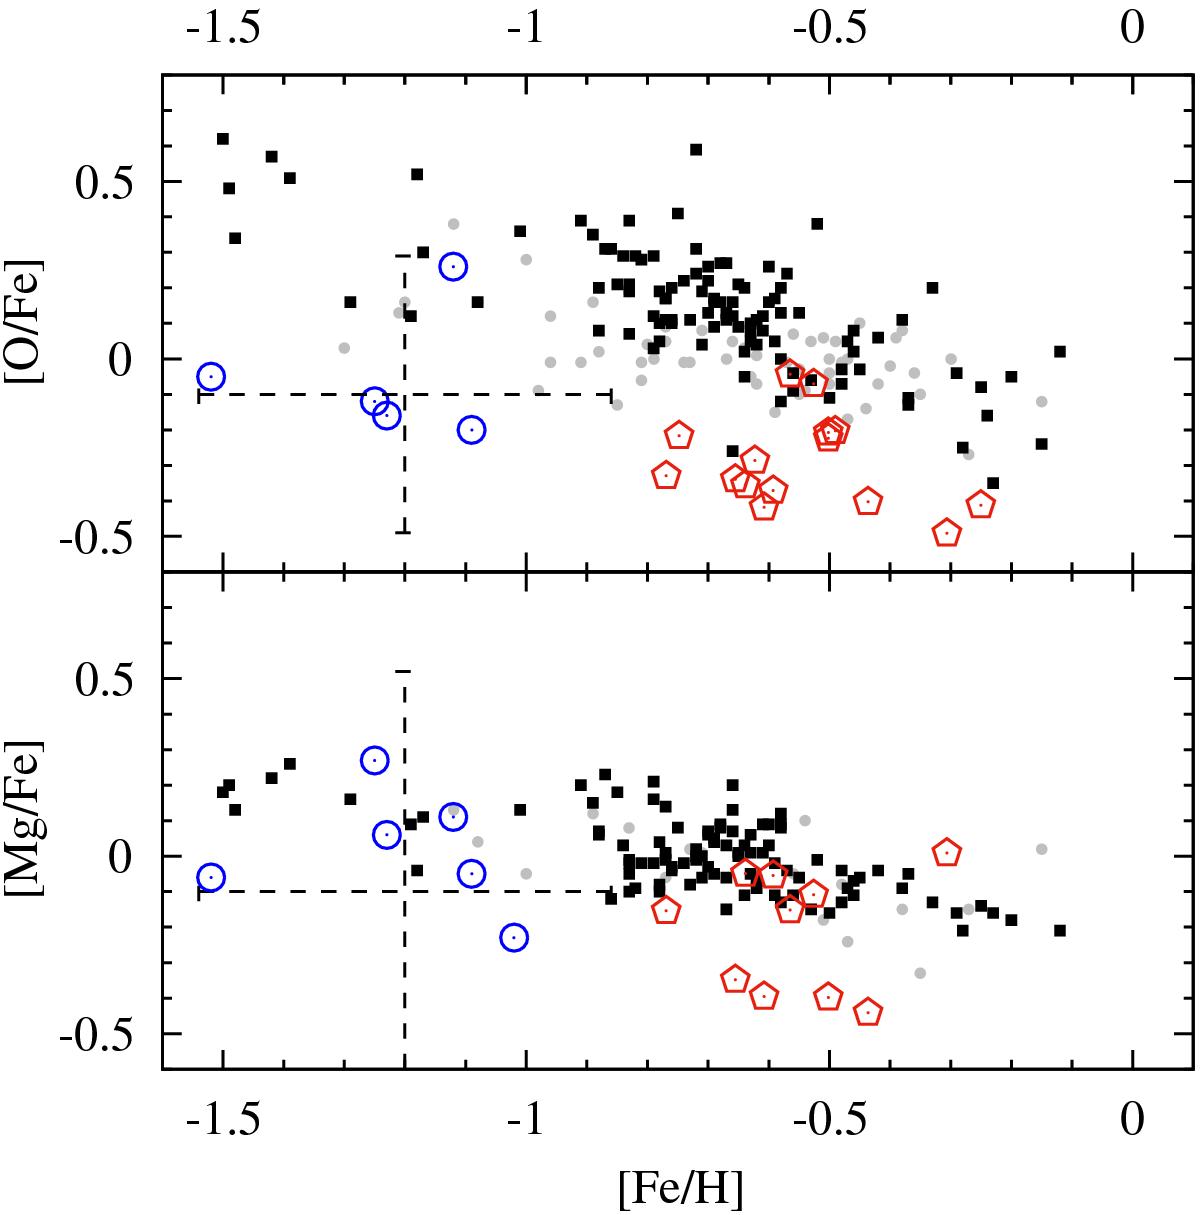
[O/Fe] and [Mg/Fe] vs. [Fe/H] diagrams for various LMC populations: abundances measured in SNRs (ISM gas phase, this work) are shown with red pentagons. The crosses indicate median error bars. Blue open circles are the old globular clusters from Johnson et al. (2006, ages ~. Chemical abundances of Bar and disc stars are marked by black squares and grey dots, respectively (from Van der Swaelmen et al. 2013, ages ≳1 Gyr).
Current usage metrics show cumulative count of Article Views (full-text article views including HTML views, PDF and ePub downloads, according to the available data) and Abstracts Views on Vision4Press platform.
Data correspond to usage on the plateform after 2015. The current usage metrics is available 48-96 hours after online publication and is updated daily on week days.
Initial download of the metrics may take a while.