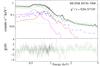
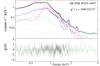
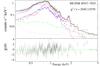
Fig. D.1
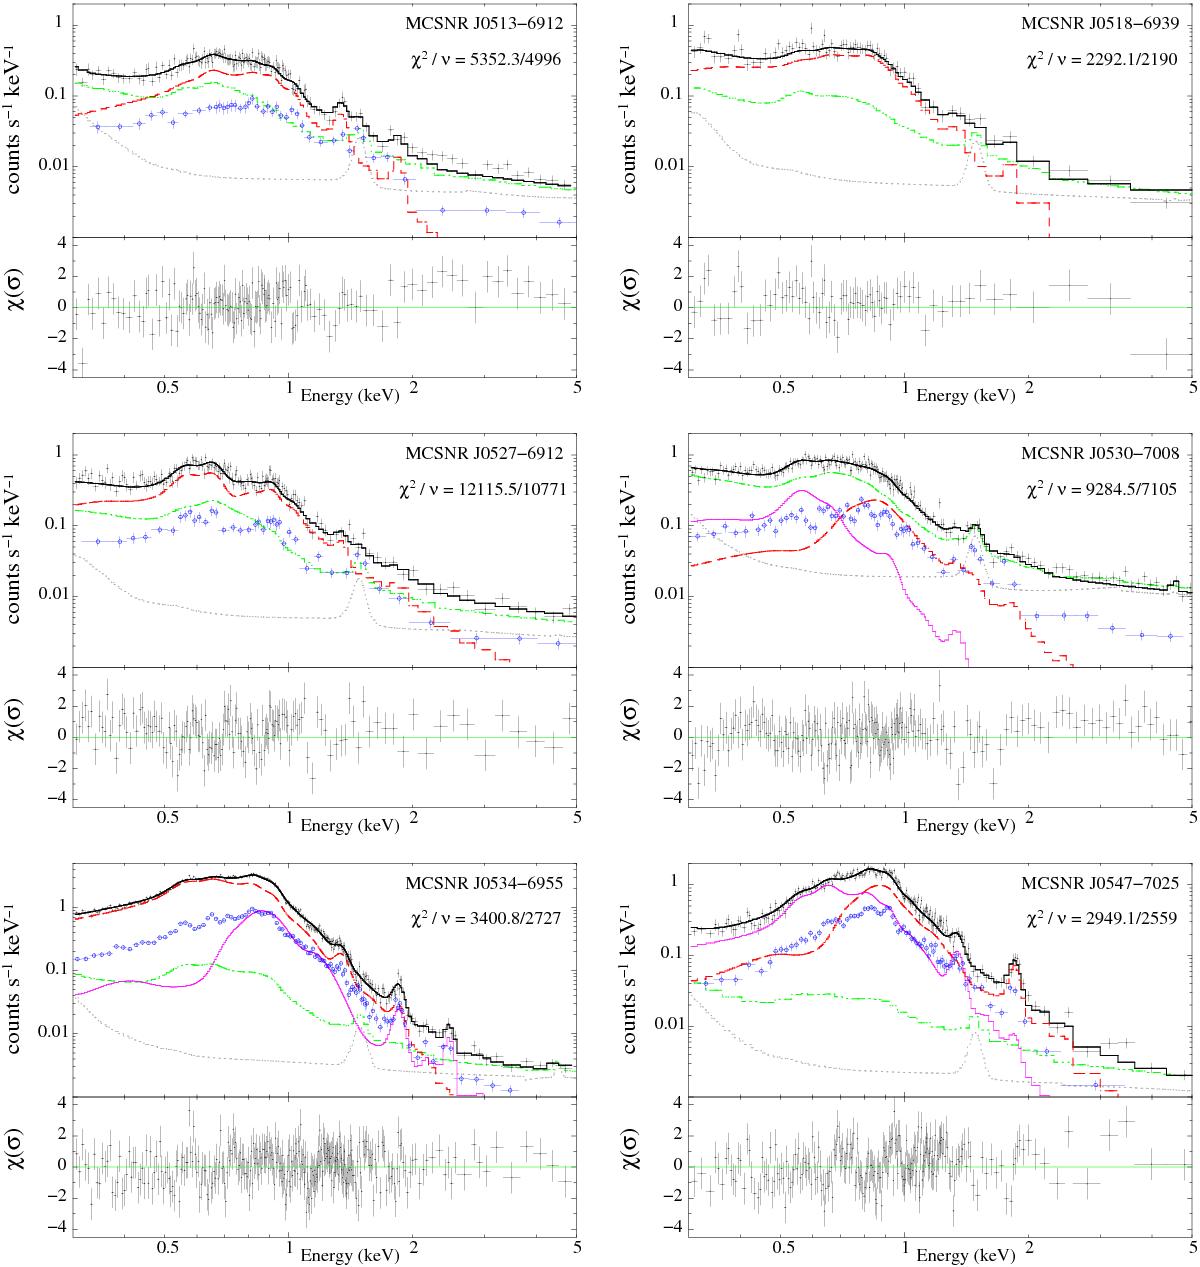
XMM-Newton EPIC spectrum of SNRs for which none have been published yet (see Sect. 5.1). The SNR names are labelled on each plot. The pn and MOS1 data are shown in black and blue points, respectively. MOS2 data are not shown for clarity. The total best-fit model (see parameters in Table E.1), convolved with the pn response, is shown as the solid black line. It includes: i) the instrumental background component with a dotted grey line (only pn shown); ii) the total AXB model (see Appendix A) with a dot-dashed green line; and iii) the SNR emission with a dashed red line. When a second component is used (Table E.1), it is shown with a solid magenta line. The lower panels show the pn residuals (in terms of σ) for the total best-fit model. For MCSNR J0527−6712 data from two observations were used, though only one spectra is shown for clarity.
Current usage metrics show cumulative count of Article Views (full-text article views including HTML views, PDF and ePub downloads, according to the available data) and Abstracts Views on Vision4Press platform.
Data correspond to usage on the plateform after 2015. The current usage metrics is available 48-96 hours after online publication and is updated daily on week days.
Initial download of the metrics may take a while.