Fig. 15
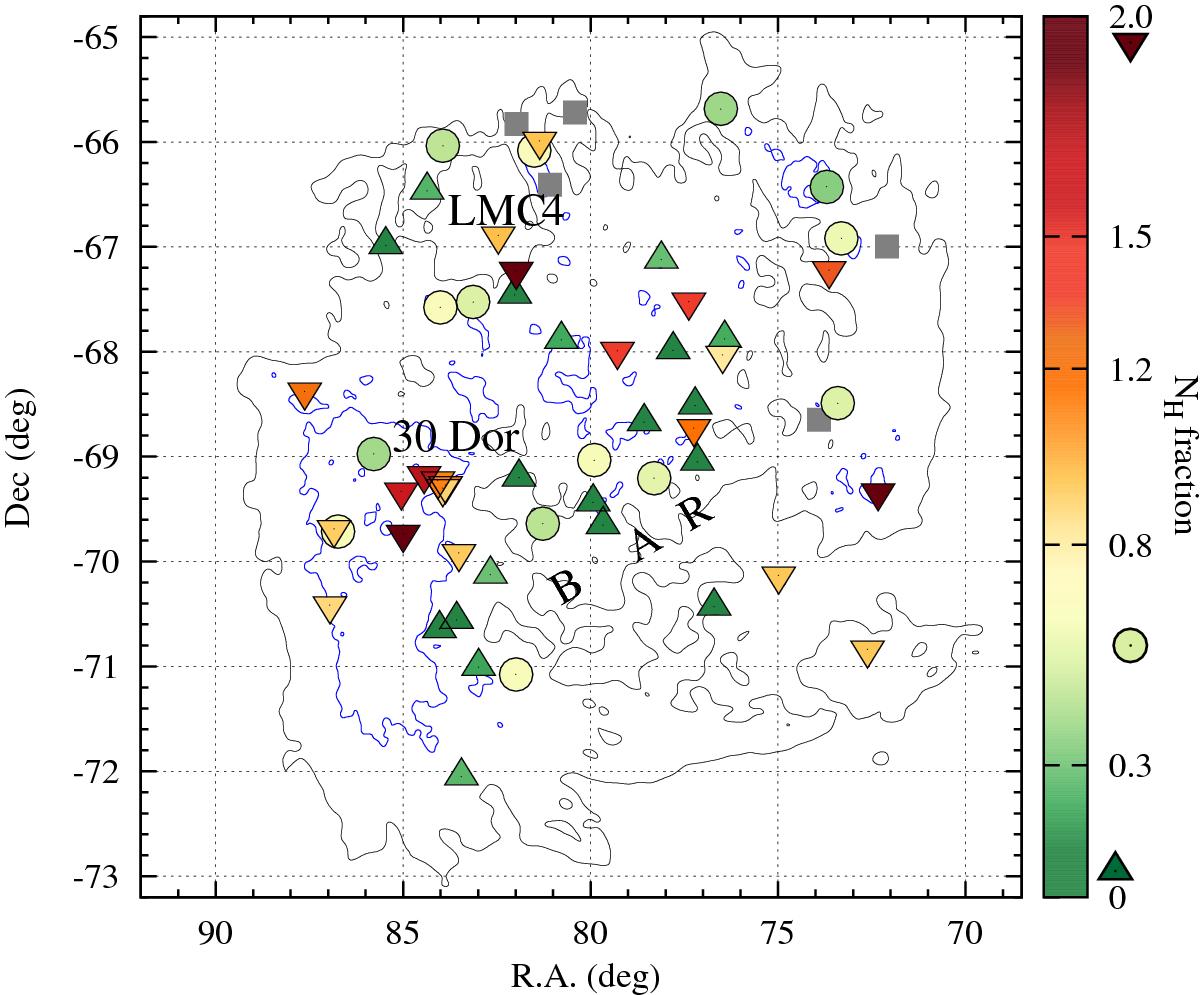
“Pseudo-3D” distribution of LMC SNRs, using NH fractions (quantified by the colour bar) as indicators of location along the line of sight. Objects “in front of the disc” (NH fraction <0.3) are marked by upward pointing triangles; downward pointing triangles are used for those “behind the disc (NH fraction >0.8). Objects within the disc (0.3 to 0.8) are marked by dots. The black and blue contours delineate H i column densities of 1 and 3 × 1021 cm-2, respectively (same as in Fig. 12). Prominent LMC structures are labelled.
Current usage metrics show cumulative count of Article Views (full-text article views including HTML views, PDF and ePub downloads, according to the available data) and Abstracts Views on Vision4Press platform.
Data correspond to usage on the plateform after 2015. The current usage metrics is available 48-96 hours after online publication and is updated daily on week days.
Initial download of the metrics may take a while.