Fig. 13
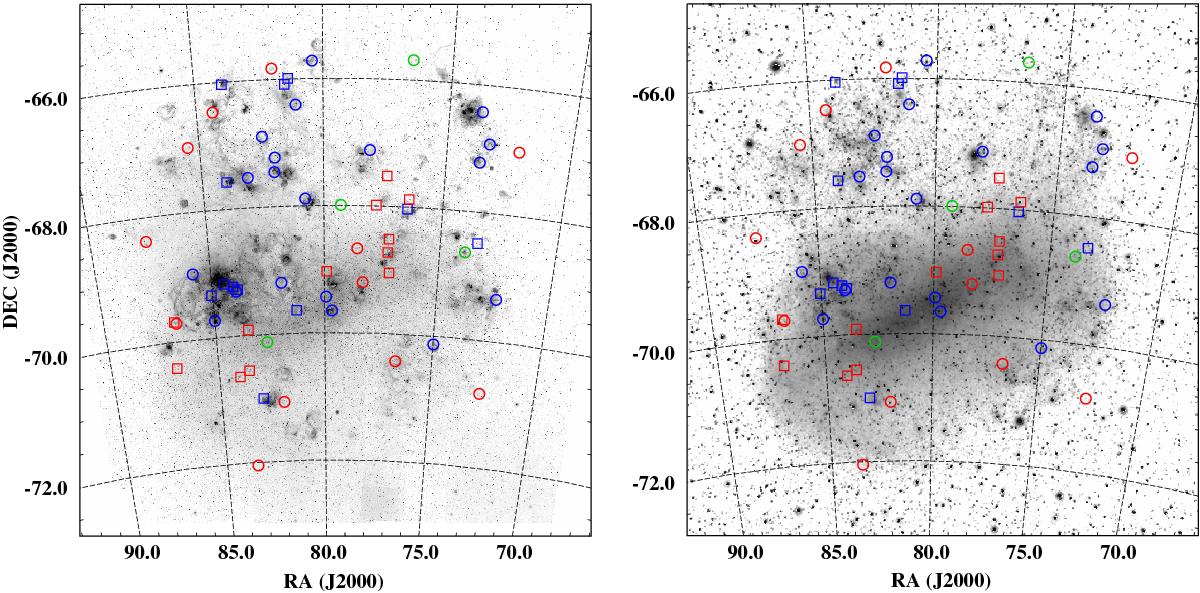
Left: location of LMC SNRs on the MCELS Hα mosaic, displayed logarithmically in greyscale. “Likely-Ia” and “secured-Ia” SNRs are marked by red circles and squares, respectively, while “likely-CC” and “secured-CC” SNRs are shown in blue. Green circles are SNRs with undecided type. Right: same as left on a red continuum image from the SHASSA survey.
Current usage metrics show cumulative count of Article Views (full-text article views including HTML views, PDF and ePub downloads, according to the available data) and Abstracts Views on Vision4Press platform.
Data correspond to usage on the plateform after 2015. The current usage metrics is available 48-96 hours after online publication and is updated daily on week days.
Initial download of the metrics may take a while.