Fig. 12
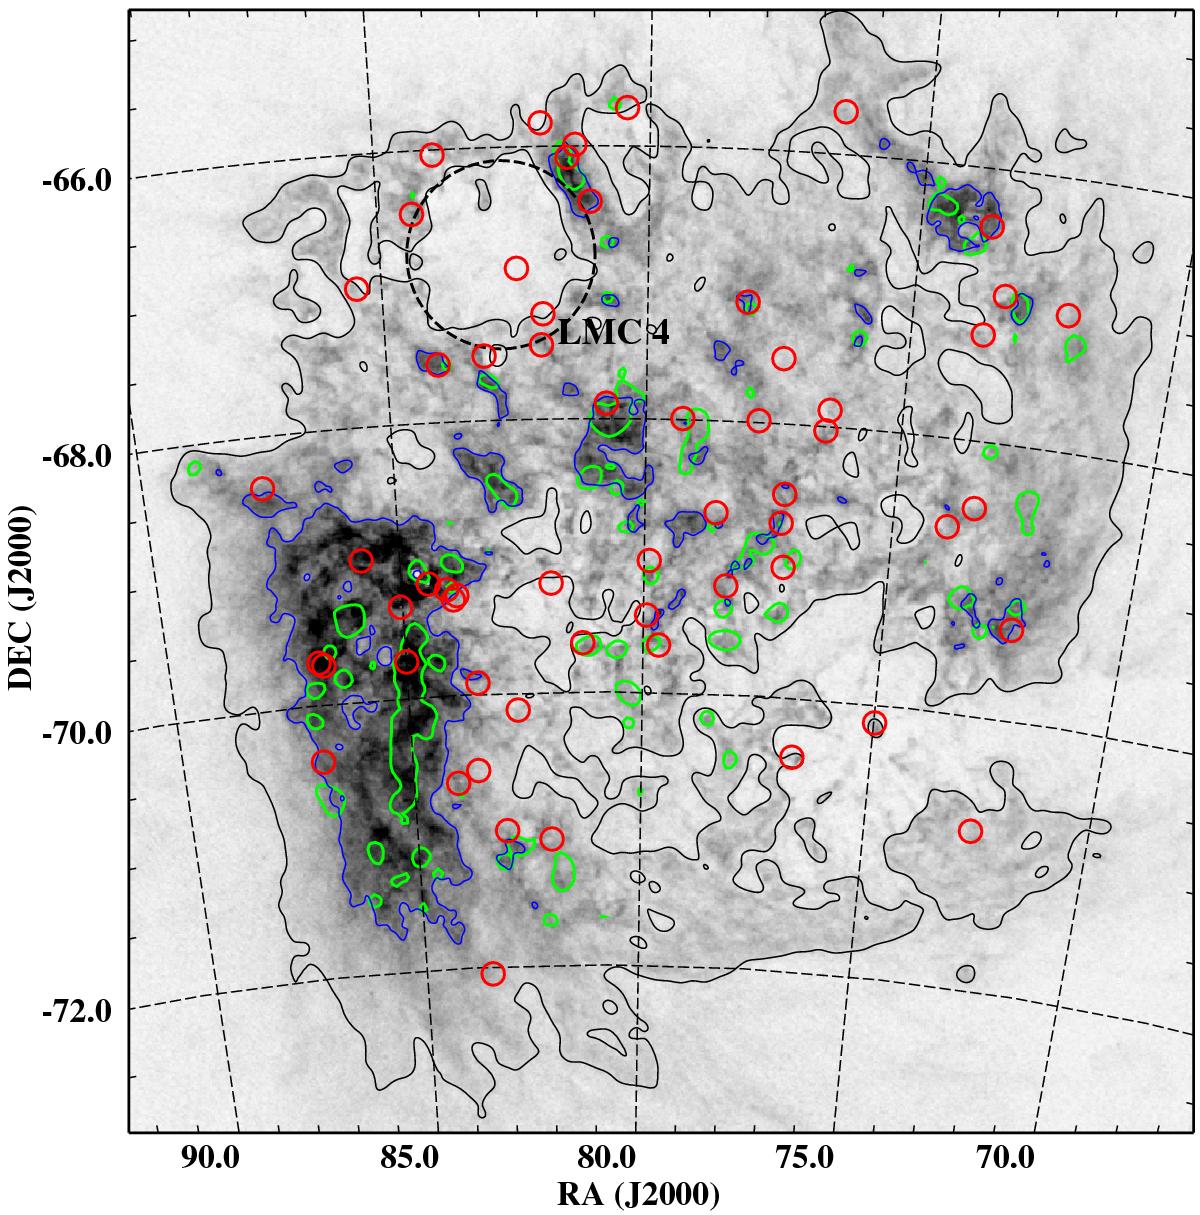
Positions of LMC SNRs (red circles) on the H i column density map of Kim et al. (2003), displayed on a linear scale ranging from 0 to 6 × 1021 cm-2. Black and blue contours indicate levels of 1 and 3 × 1021 cm-2, respectively. The green contours are the 3σ level (1.2 K km s-1) of the velocity-integrated map of 12CO (J = 1−0) from the NANTEN survey (Fukui et al. 2008). The position of the SGS LMC 4 is marked with a dashed black circle.
Current usage metrics show cumulative count of Article Views (full-text article views including HTML views, PDF and ePub downloads, according to the available data) and Abstracts Views on Vision4Press platform.
Data correspond to usage on the plateform after 2015. The current usage metrics is available 48-96 hours after online publication and is updated daily on week days.
Initial download of the metrics may take a while.