Fig. 11
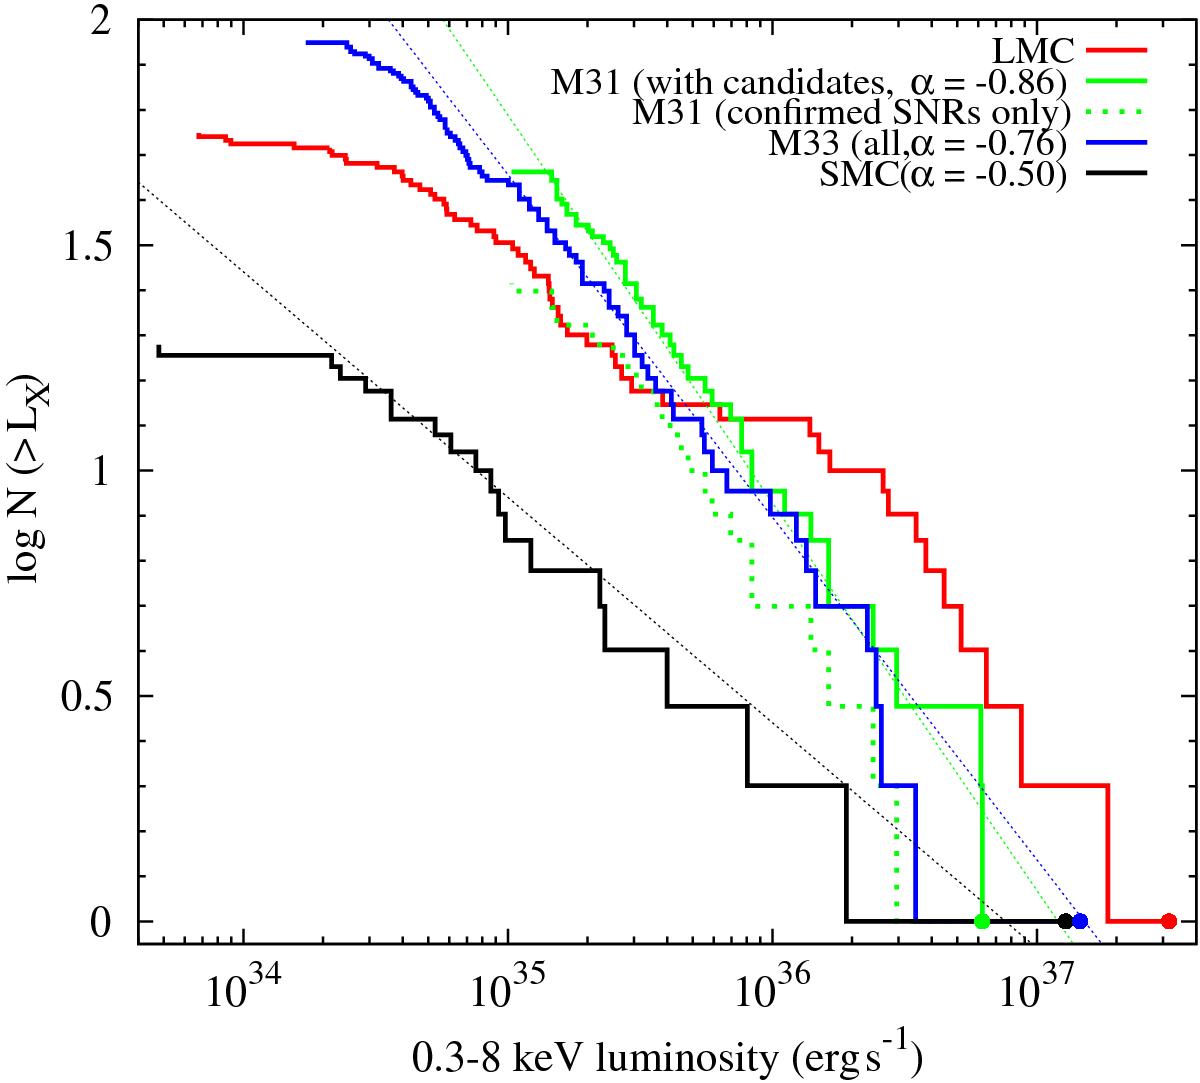
Cumulative X-ray luminosity function of SNRs in Local Group galaxies. See text for details and references on how LX was measured for each sample. The brightest SNR in each galaxy is marked by a dot. The thin dotted lines are nonlinear least-square fits of a power law (N( >LX) ∝ LXα). Slopes α are given in the legend. These fits are only used to characterise the slopes and illustrate the differences between galaxies; they do not represent a physical fit of the population.
Current usage metrics show cumulative count of Article Views (full-text article views including HTML views, PDF and ePub downloads, according to the available data) and Abstracts Views on Vision4Press platform.
Data correspond to usage on the plateform after 2015. The current usage metrics is available 48-96 hours after online publication and is updated daily on week days.
Initial download of the metrics may take a while.