Fig. 1
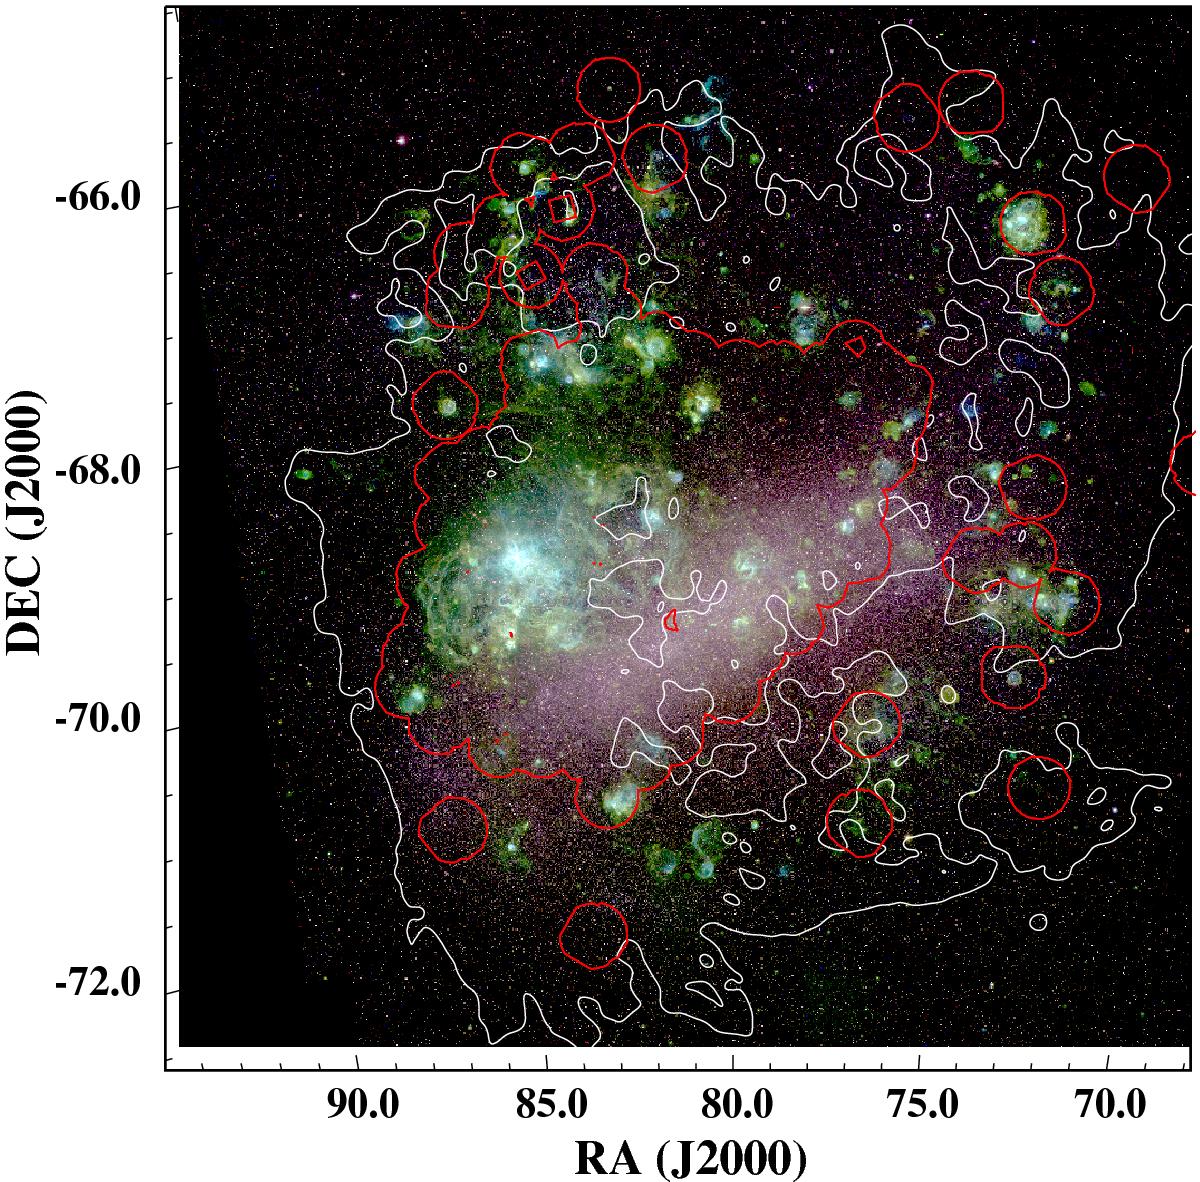
The LMC in the light of [S ii] (red), Hα (green), and [O iii] (blue), all data from MCELS (see Sect. 2.3). The red contours delineates the coverage of the LMC with XMM-Newton, combining archival data and observations of our large survey (see Sect. 2.1). The white contours outline a LMC H i column density of 1 × 1021 cm-2 (data from Kim et al. 2003).
Current usage metrics show cumulative count of Article Views (full-text article views including HTML views, PDF and ePub downloads, according to the available data) and Abstracts Views on Vision4Press platform.
Data correspond to usage on the plateform after 2015. The current usage metrics is available 48-96 hours after online publication and is updated daily on week days.
Initial download of the metrics may take a while.