Free Access
Fig. 1
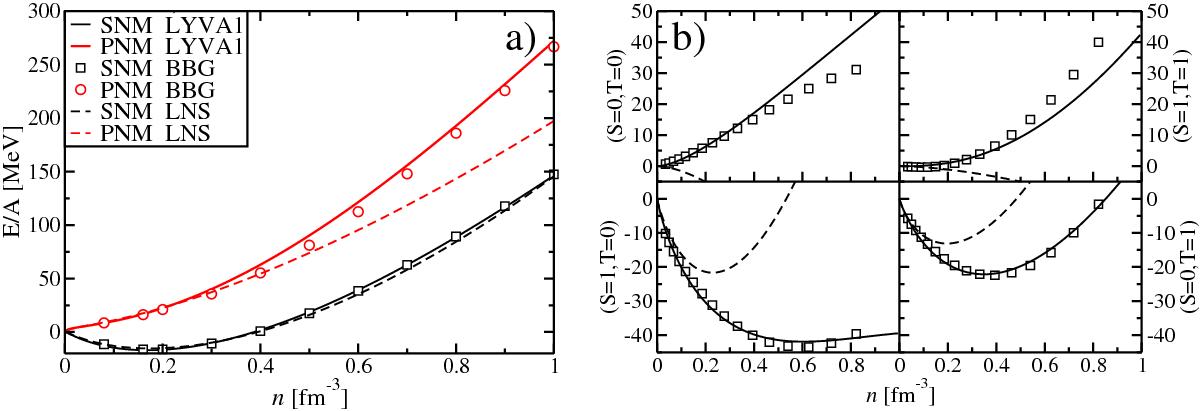
Equations of state of SNM and PNM (panel a)) and projections (S,T) in SNM (panel b)), both expressed in MeV. The solid lines represent the result obtained with our extended Skyrme interaction, while the dots represent the EoS obtained by (Baldo et al. 1997). The LNS results are represented by dashed-lines.
This figure is made of several images, please see below:
Current usage metrics show cumulative count of Article Views (full-text article views including HTML views, PDF and ePub downloads, according to the available data) and Abstracts Views on Vision4Press platform.
Data correspond to usage on the plateform after 2015. The current usage metrics is available 48-96 hours after online publication and is updated daily on week days.
Initial download of the metrics may take a while.