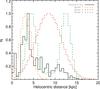
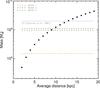
Fig. 10

Top: distance distributions used for the mass estimates. Solid line corresponds to the NH3 observations by Wienen et al. (2012). Dashed lines show the three models discussed in Sect. 4.3. Bottom: molecular gas mass estimate for the inner Galaxy (| ℓ | < 60° and | b | < 1.4°) from the ATLASGAL APEX/LABOCA and Planck/HFI combined maps of dust emission at 870 μm. Dots show the observed total mass as a function of a single adopted distance. Dashed line shows the mass estimation estimated with a Monte Carlo simulation. Red line shows the total estimated molecular gas mass based on CO measurements (Solomon et al. 1987).
Current usage metrics show cumulative count of Article Views (full-text article views including HTML views, PDF and ePub downloads, according to the available data) and Abstracts Views on Vision4Press platform.
Data correspond to usage on the plateform after 2015. The current usage metrics is available 48-96 hours after online publication and is updated daily on week days.
Initial download of the metrics may take a while.