Fig. 6
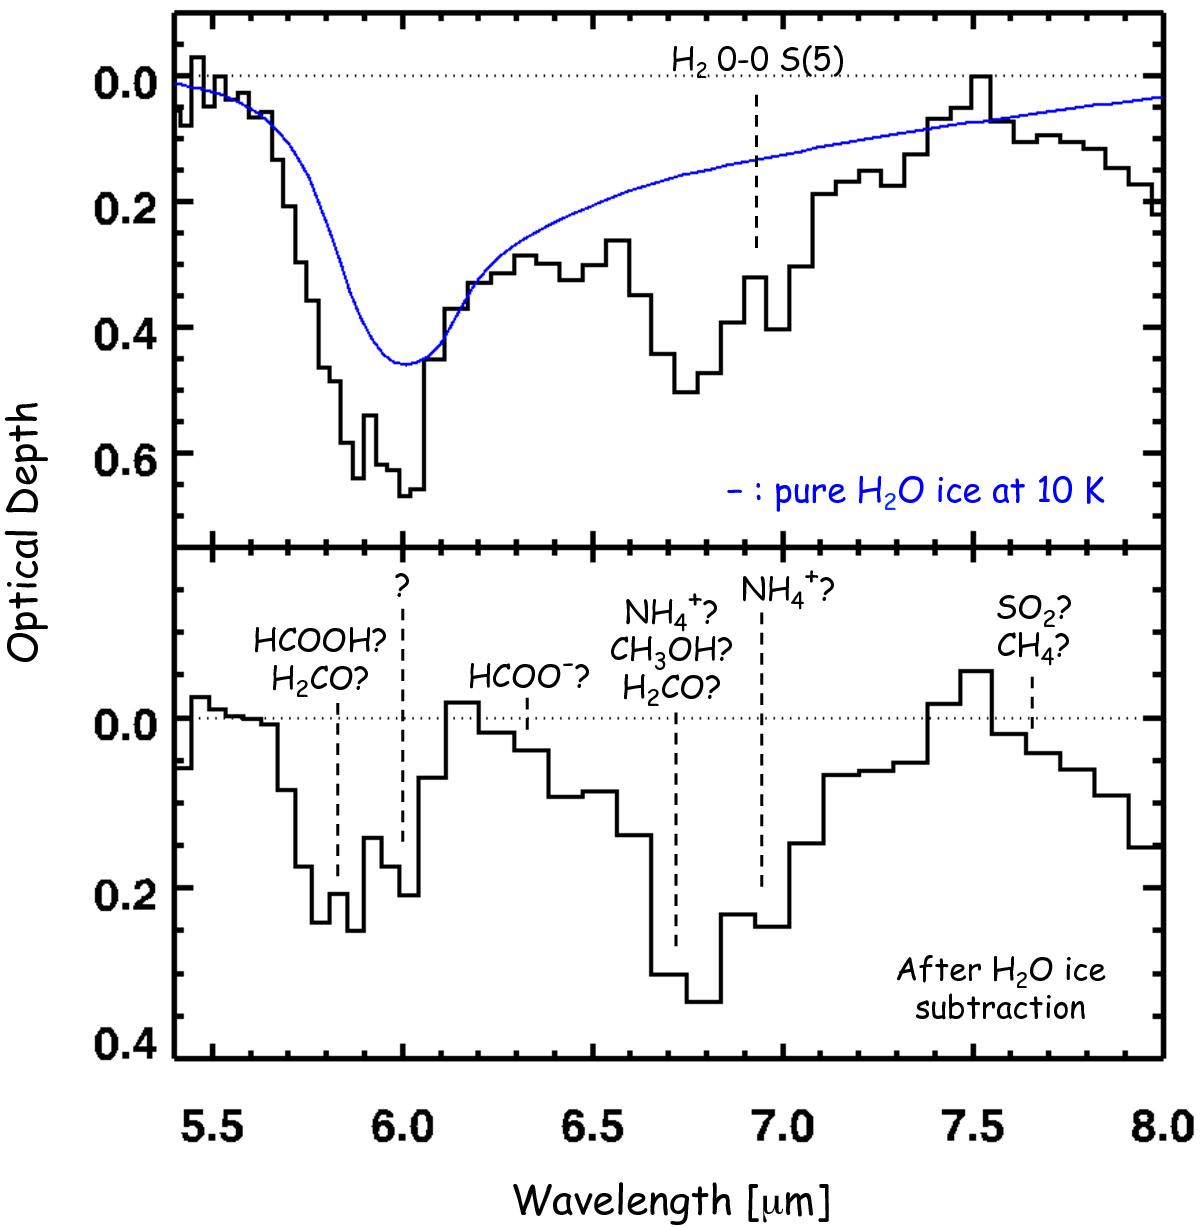
Upper panel: optical depth spectrum of ST6 in the 5.5–8 μm region. The smooth solid line (blue) indicates the expected spectrum of the 6.0 μm water ice band, whose strength is estimated based on the 3.05 μm band. Lower panel: spectrum after subtraction of the 6.0 μm water ice band. Absorption components that cannot be explained by the water ice are seen in the spectrum. Possible identifications of these absorption bands are indicated.
Current usage metrics show cumulative count of Article Views (full-text article views including HTML views, PDF and ePub downloads, according to the available data) and Abstracts Views on Vision4Press platform.
Data correspond to usage on the plateform after 2015. The current usage metrics is available 48-96 hours after online publication and is updated daily on week days.
Initial download of the metrics may take a while.