Fig. 5
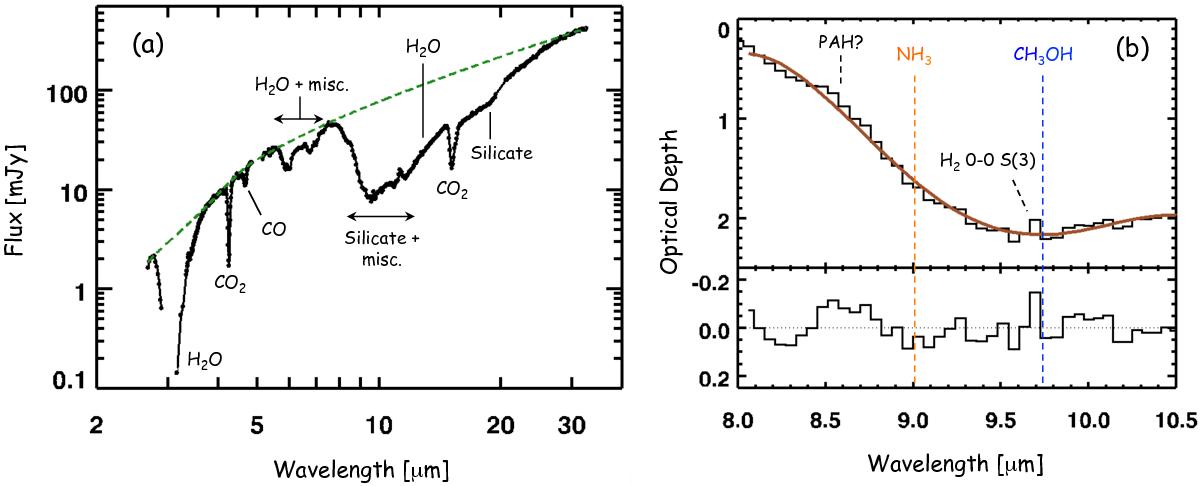
a) AKARI/IRC 2.5–5 μm and Spitzer/IRS 5–33 μm spectrum of ST6. The derived continuum is shown with dashed lines (green). Detected absorption bands of solids are labeled. b) Upper panel: optical depth spectrum of ST6 in the 8–10.5 μm region. The smooth solid line (brown) indicates the fitted profile of the silicate absorption band. Lower panel: residual spectrum after the subtraction of the silicate absorption band. Absorption bands of the NH3 ice at 9.0 μm and CH3OH ice at 9.75 μm are not seen in the spectrum.
Current usage metrics show cumulative count of Article Views (full-text article views including HTML views, PDF and ePub downloads, according to the available data) and Abstracts Views on Vision4Press platform.
Data correspond to usage on the plateform after 2015. The current usage metrics is available 48-96 hours after online publication and is updated daily on week days.
Initial download of the metrics may take a while.