Free Access
Fig. 4
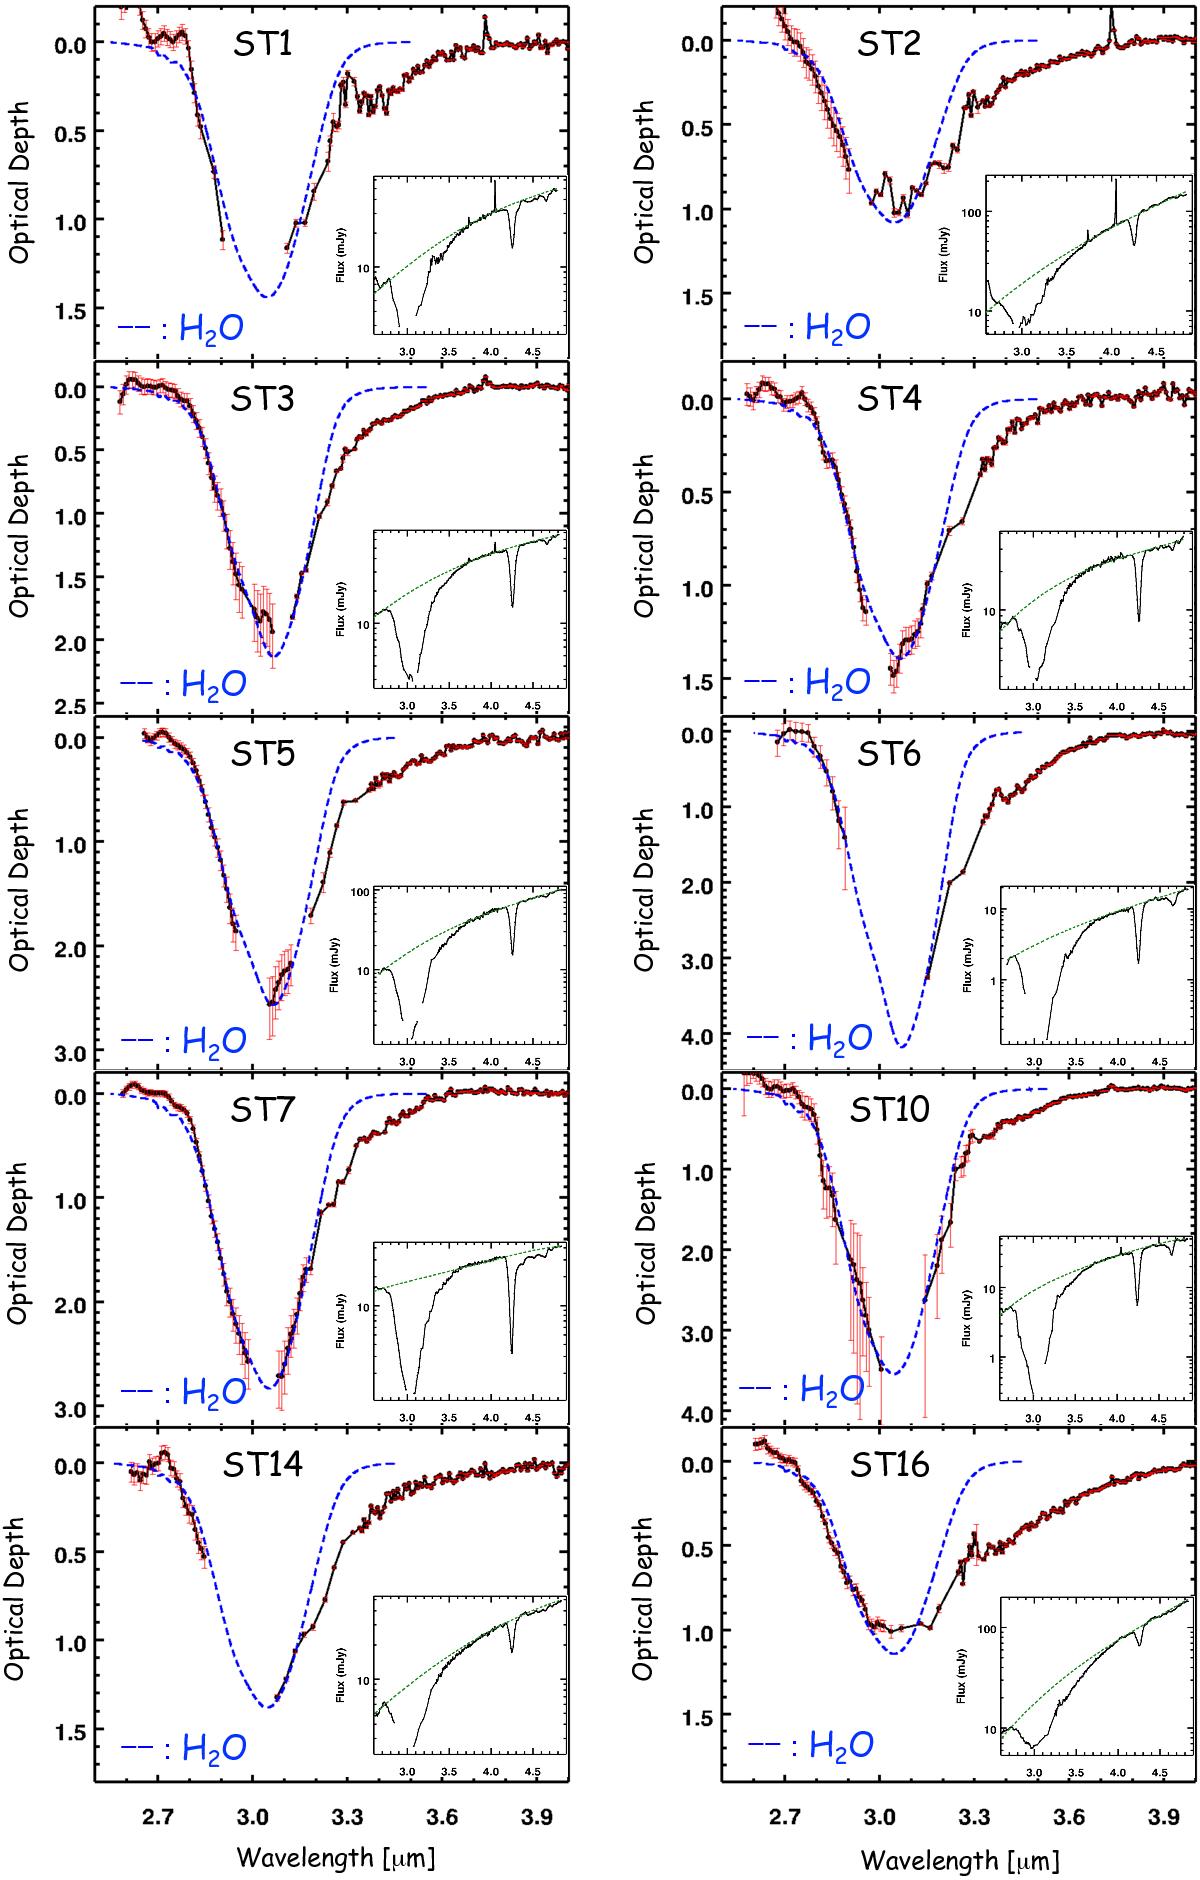
Results of the spectral analysis for the 3.05 μm H2O ice band. The dashed lines (blue) represent the laboratory H2O ice spectrum fitted to the observed spectrum (solid lines, black). Derived continua are shown in the lower right side of each panel with dashed lines (green).
Current usage metrics show cumulative count of Article Views (full-text article views including HTML views, PDF and ePub downloads, according to the available data) and Abstracts Views on Vision4Press platform.
Data correspond to usage on the plateform after 2015. The current usage metrics is available 48-96 hours after online publication and is updated daily on week days.
Initial download of the metrics may take a while.