Fig. 3
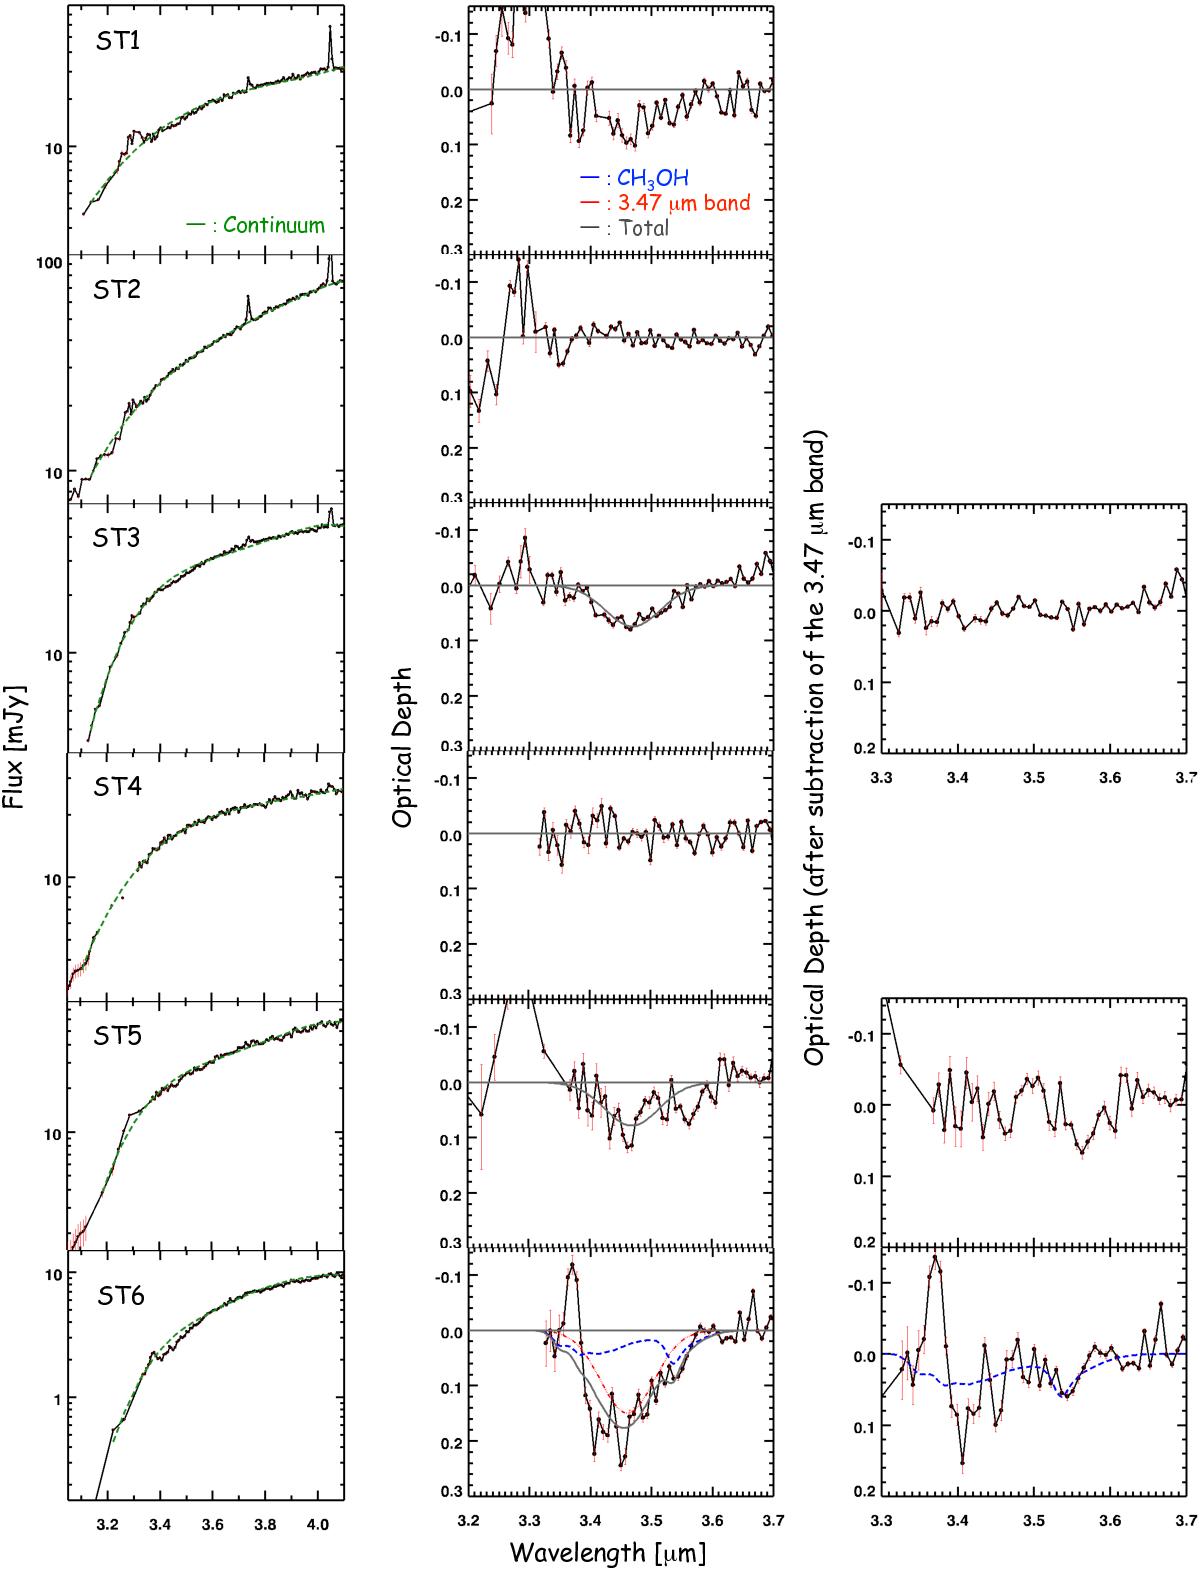
Results of the spectral analysis for the 3.47 μm and 3.53 μm (CH3OH) absorption bands. Left: derived continua (dashed lines, green) are shown with the observed spectra. Middle: results of the spectral fitting. The dashed lines (blue) represent the laboratory CH3OH ice spectrum and the dot-dashed lines (red) represent the 3.47 μm absorption band. The solid lines (gray) show the sum of those two components. Right: residual spectra after subtraction of the 3.47 μm band. The spectra are only shown for the sources in which the 3.47 μm band is detected.
Current usage metrics show cumulative count of Article Views (full-text article views including HTML views, PDF and ePub downloads, according to the available data) and Abstracts Views on Vision4Press platform.
Data correspond to usage on the plateform after 2015. The current usage metrics is available 48-96 hours after online publication and is updated daily on week days.
Initial download of the metrics may take a while.