Fig. A.1
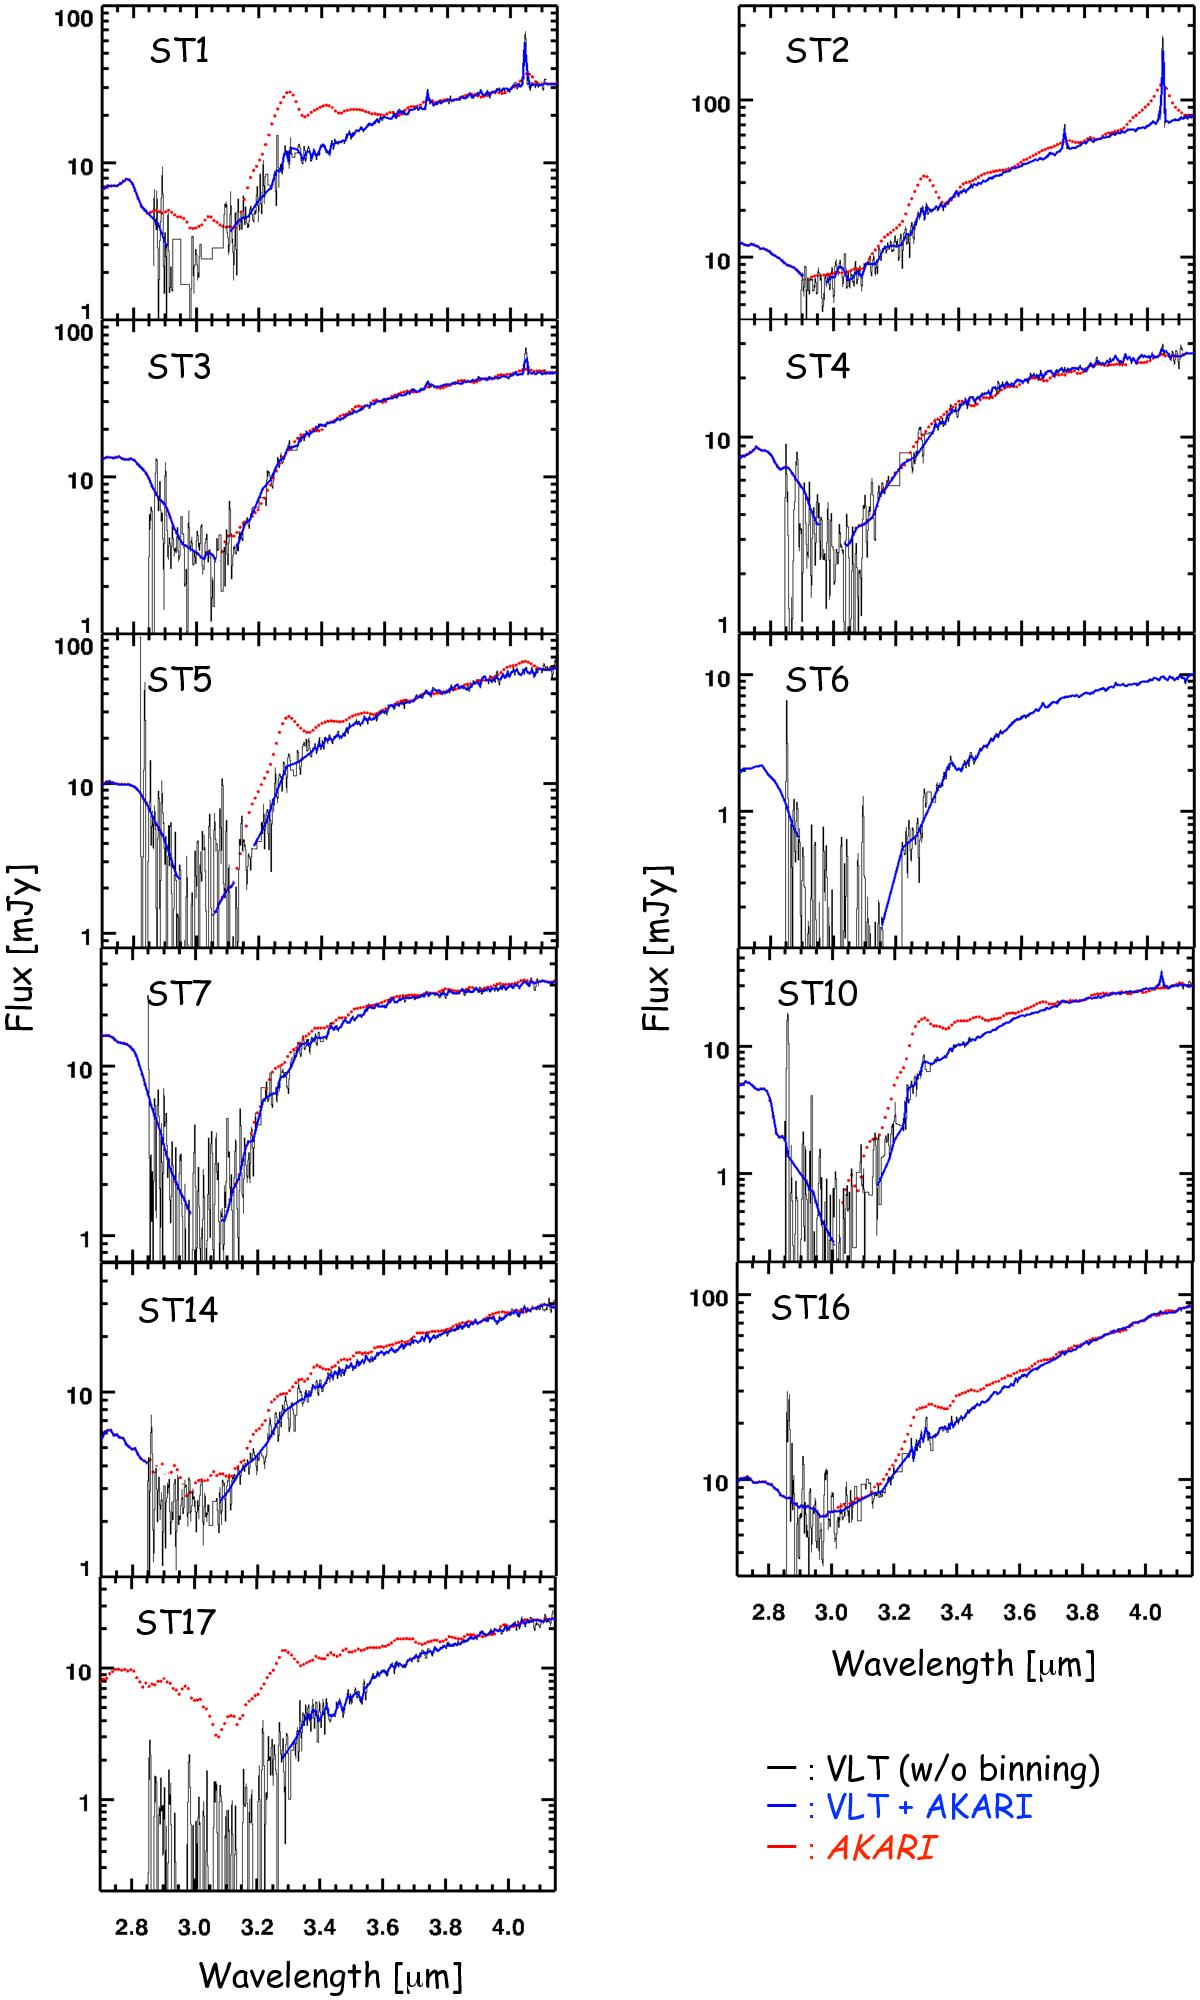
Comparison of VLT/ISAAC and AKARI/IRC spectra. The thin solid lines (black) represent the VLT spectra before applying spectral binning. The thick lines (blue) represent concatenated VLT and AKARI spectra after binning. The circles (red) represent the AKARI spectra before concatenation with VLT spectra. A detailed description about the spectra is given in Sect. 3.1.
Current usage metrics show cumulative count of Article Views (full-text article views including HTML views, PDF and ePub downloads, according to the available data) and Abstracts Views on Vision4Press platform.
Data correspond to usage on the plateform after 2015. The current usage metrics is available 48-96 hours after online publication and is updated daily on week days.
Initial download of the metrics may take a while.