Fig. 10
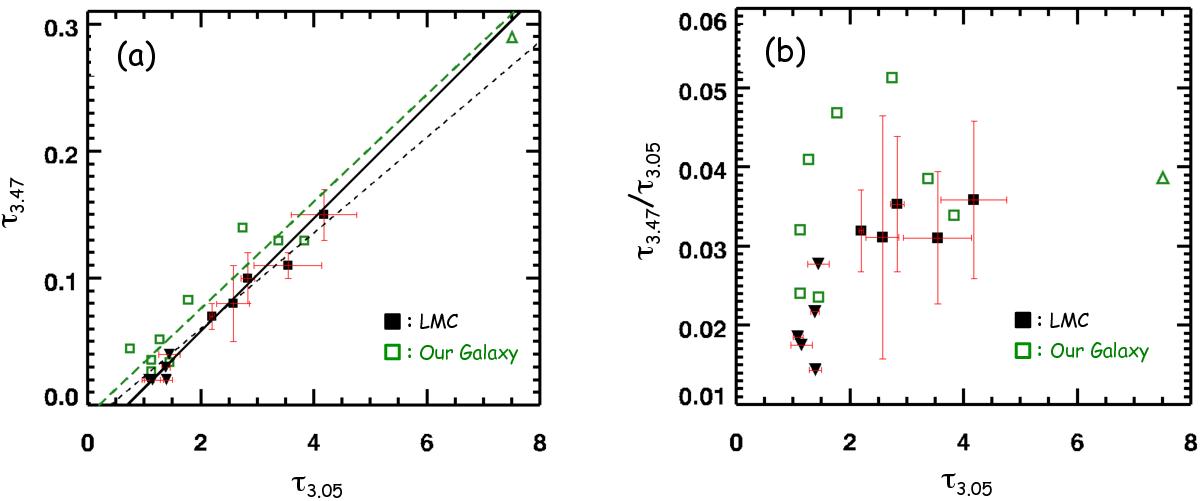
a) Optical depths of the 3.05 μm H2O ice band vs. the 3.47 μm band. Filled (black) and open (green) squares represent data points of the LMC high-mass YSOs (this work) and Galactic high-mass YSOs (see Table 6 for references). The upward and downward triangles represents the lower and upper limit. Solid (black) and dashed (green) lines represent the results of a straight-line fit to LMC and Galactic data points, respectively. The best-fit line is τ3.47 = 0.044τ3.05−0.030 for the LMC, and τ3.47 = 0.043τ3.05−0.008 for our Galaxy. The straight-line fit without upper limit points is also shown with black dashed line for the LMC data. The figure shows that the slope of the τ3.47 and τ3.05 correlation is similar between the LMC and Galactic sources. b) Optical depth ratio of τ3.47/τ3.05 vs. τ3.05. The symbols are same as in the left panel. For the LMC sources with τ3.05< 2, the τ3.47/τ3.05 ratio is significantly lower than Galactic sources, which suggests the presence of threshold τ3.05 for the appearance of the 3.47 μm band in the LMC.
Current usage metrics show cumulative count of Article Views (full-text article views including HTML views, PDF and ePub downloads, according to the available data) and Abstracts Views on Vision4Press platform.
Data correspond to usage on the plateform after 2015. The current usage metrics is available 48-96 hours after online publication and is updated daily on week days.
Initial download of the metrics may take a while.