Fig. 1
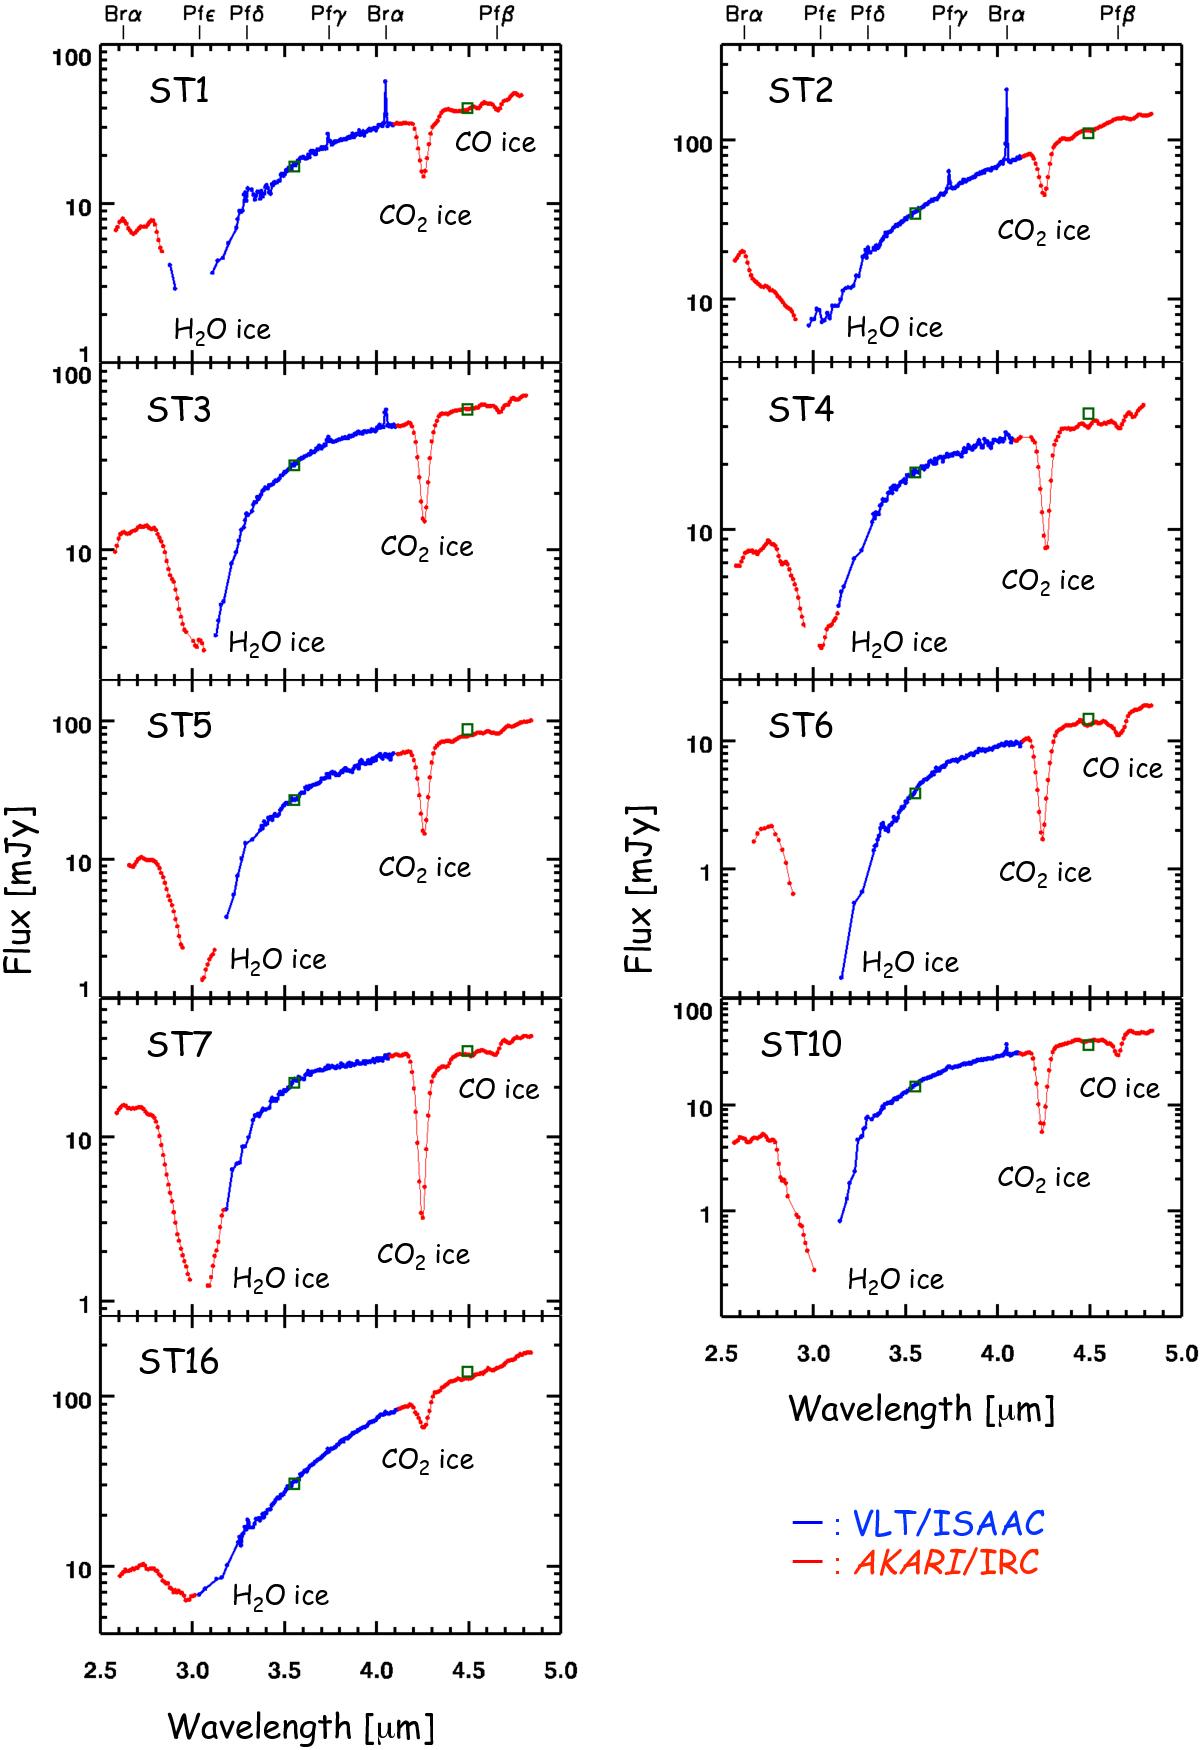
VLT/ISAAC and AKARI/IRC 2.5–5 μm spectra of embedded high-mass YSOs in the LMC. The blue circles connected by thick lines represent the VLT L-band spectra obtained in this work. The red circles connected by thin lines represent the AKARI spectra (the original data taken from Shimonishi et al. 2010; Shimonishi 2012). The green open squares represent photometric fluxes of Spitzer/IRAC band 1 (3.55 μm) and band 2 (4.5 μm) measured in the SAGE survey. Detected ice absorption bands are labeled in each panel and the wavelengths of hydrogen recombination lines are indicated in the upper panels.
Current usage metrics show cumulative count of Article Views (full-text article views including HTML views, PDF and ePub downloads, according to the available data) and Abstracts Views on Vision4Press platform.
Data correspond to usage on the plateform after 2015. The current usage metrics is available 48-96 hours after online publication and is updated daily on week days.
Initial download of the metrics may take a while.