Fig. 3
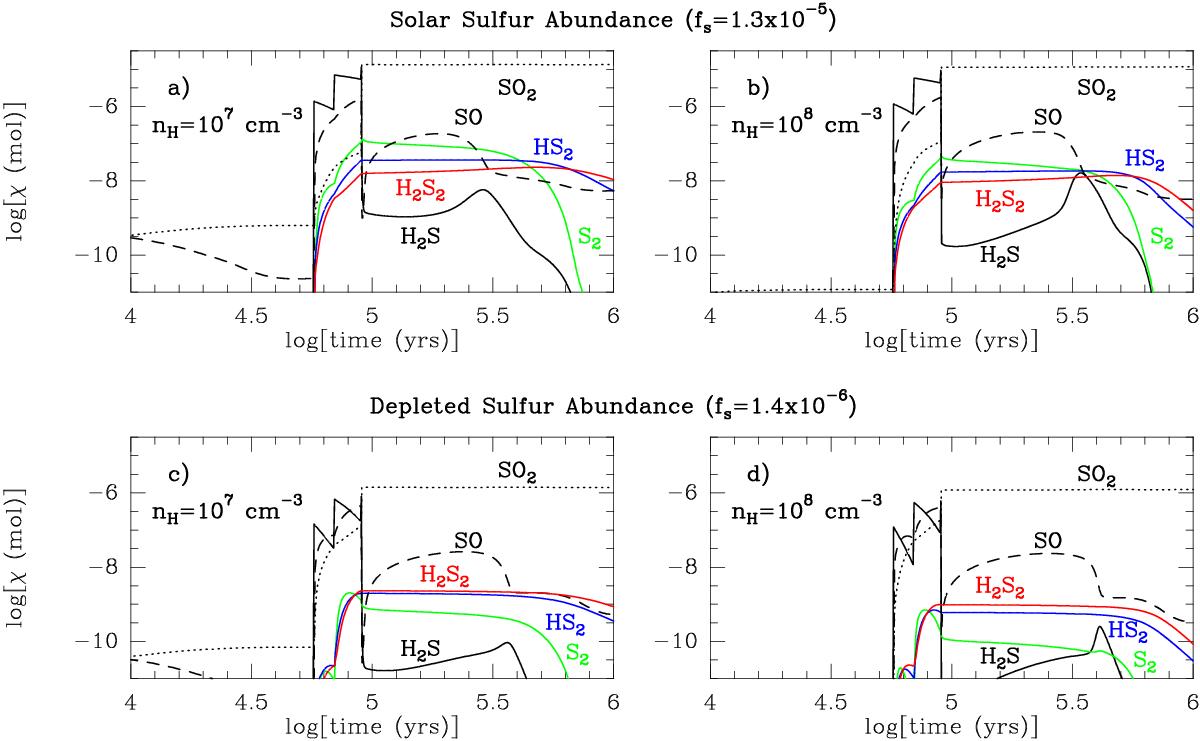
Time-dependent evolution of abundances of selected sulfur-bearing species in IRAS 16293 according to the UCL_CHEM code for models a), b), c), and d), whose most important parameters are shown in Table 3. Colored lines correspond to the targeted species. Black solid line is for H2S. Black dashed and dotted lines correspond to SO and SO2, respectively.
Current usage metrics show cumulative count of Article Views (full-text article views including HTML views, PDF and ePub downloads, according to the available data) and Abstracts Views on Vision4Press platform.
Data correspond to usage on the plateform after 2015. The current usage metrics is available 48-96 hours after online publication and is updated daily on week days.
Initial download of the metrics may take a while.