Free Access
Fig. 2
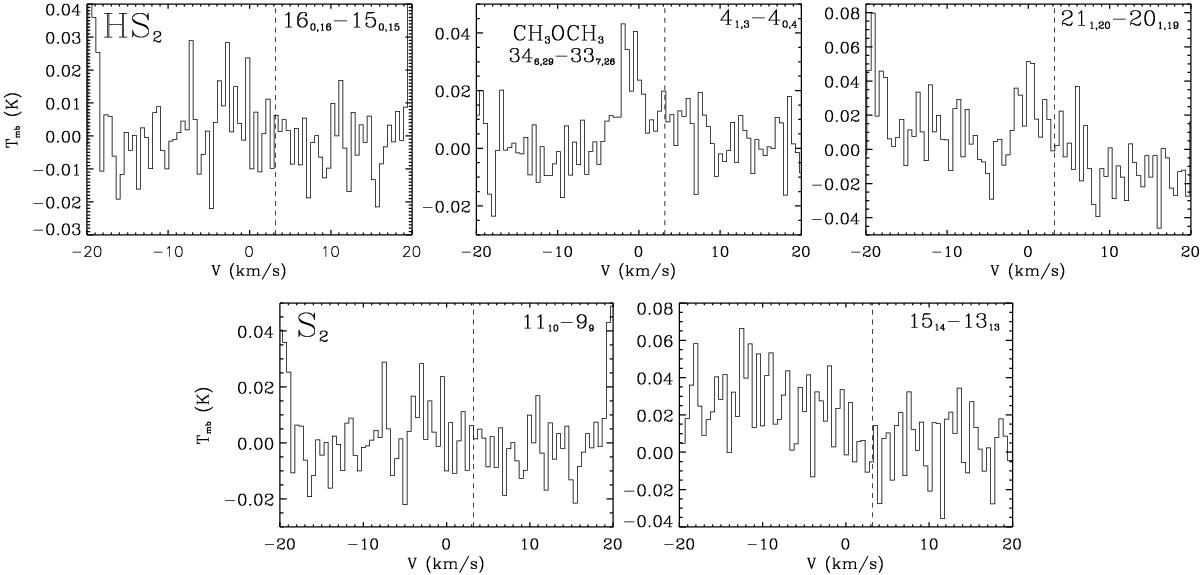
Spectral windows where the HS![]() (top panels) and S2 (bottom panels) transitions listed in Table 1 should be detected. Vertical dashed lines mark a central radial velocity of vlsr = 3.2 km s-1, assumed for IRAS 16293 A (Jørgensen et al. 2011).
(top panels) and S2 (bottom panels) transitions listed in Table 1 should be detected. Vertical dashed lines mark a central radial velocity of vlsr = 3.2 km s-1, assumed for IRAS 16293 A (Jørgensen et al. 2011).
Current usage metrics show cumulative count of Article Views (full-text article views including HTML views, PDF and ePub downloads, according to the available data) and Abstracts Views on Vision4Press platform.
Data correspond to usage on the plateform after 2015. The current usage metrics is available 48-96 hours after online publication and is updated daily on week days.
Initial download of the metrics may take a while.