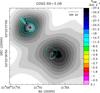
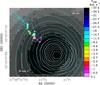
Fig. 8
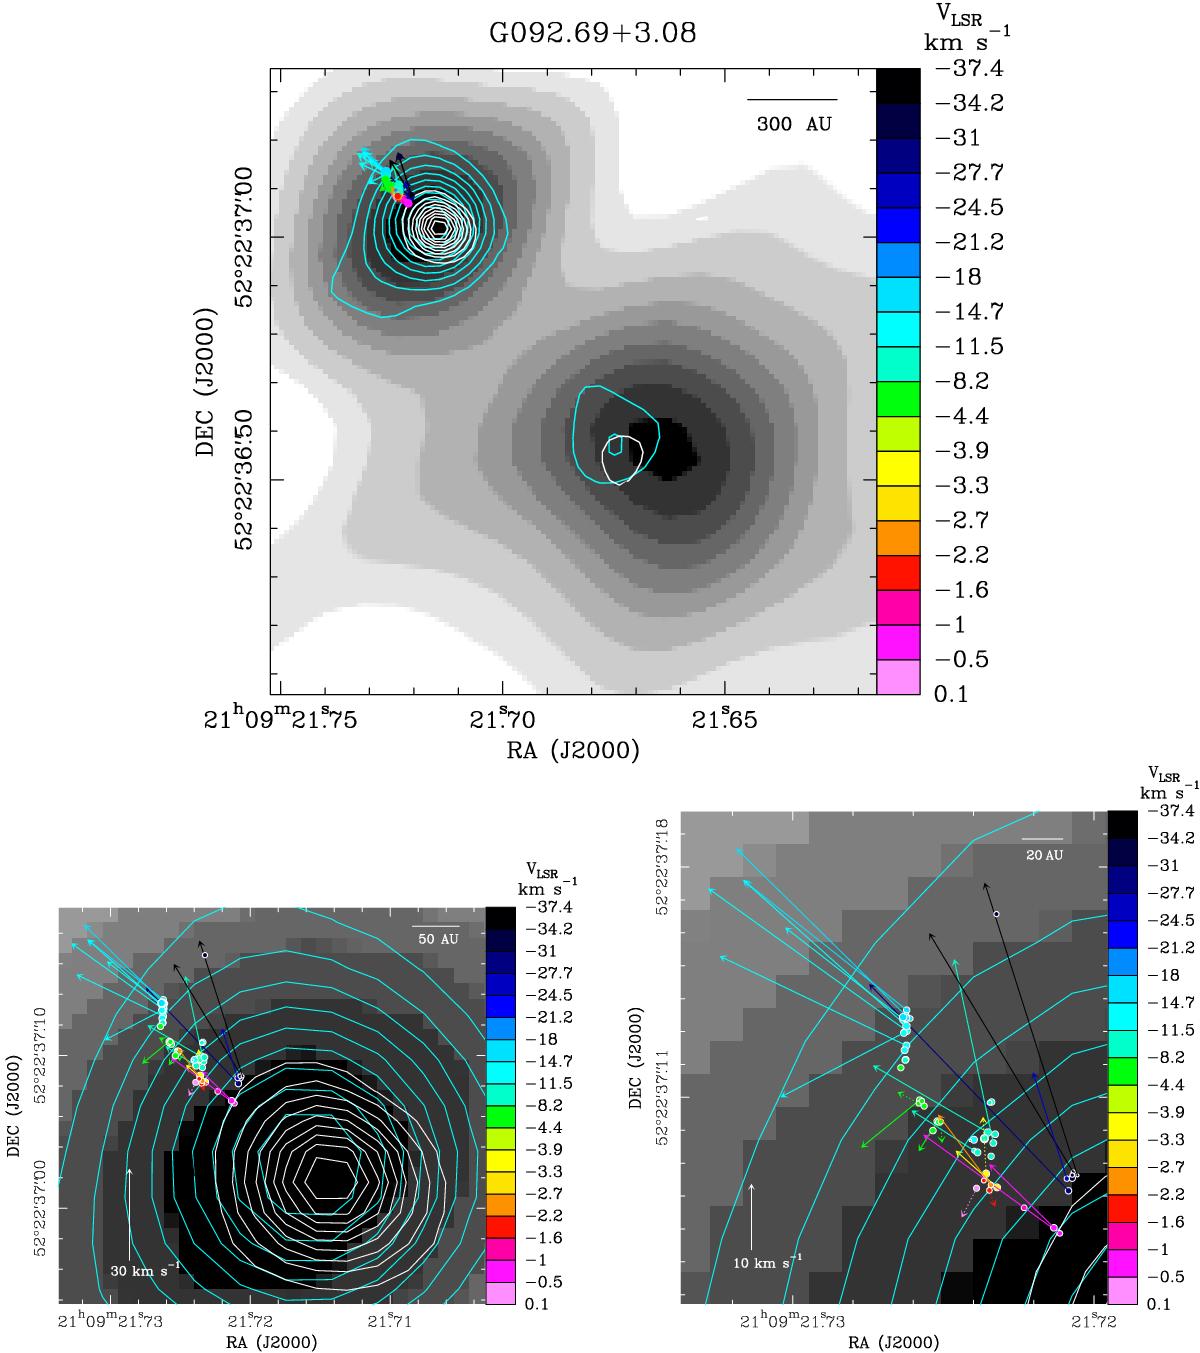
Top panel: gray-scale image: JVLA A-Array C-band continuum, using gray-tone steps that increase linearly with the map intensity from 0.010 to 0.096 mJy beam-1. The JVLA A-Array Ku-band continuum is represented with cyan contours with plotted levels −10% and from 10% to 90%, in steps of 10%, of the peak value of 0.26 mJy beam-1. The white contours reproduce the JVLA A-Array K-band continuum, plotting levels −10% and from 10% to 90%, in steps of 10%, of the peak value of 0.5 mJy beam-1. Colored dots and arrows have the same meaning as in Fig. 1. Bottom panels: zoom on the area of the main, compact Ku- and K-band continuum sources (left) and on the water maser emission (right). In both panels, the gray-scale image, the cyan and white contours have the same meaning as in the top panel. Colored dots and arrows have the same meaning as in Fig. 1: for this clustered maser source, to better distinguish maser positions on top of the dark background, the colored dots are white-bordered. The amplitude scale for the maser velocity is indicated by the white arrow in the bottom left of the panels.
Current usage metrics show cumulative count of Article Views (full-text article views including HTML views, PDF and ePub downloads, according to the available data) and Abstracts Views on Vision4Press platform.
Data correspond to usage on the plateform after 2015. The current usage metrics is available 48-96 hours after online publication and is updated daily on week days.
Initial download of the metrics may take a while.