Fig. 2
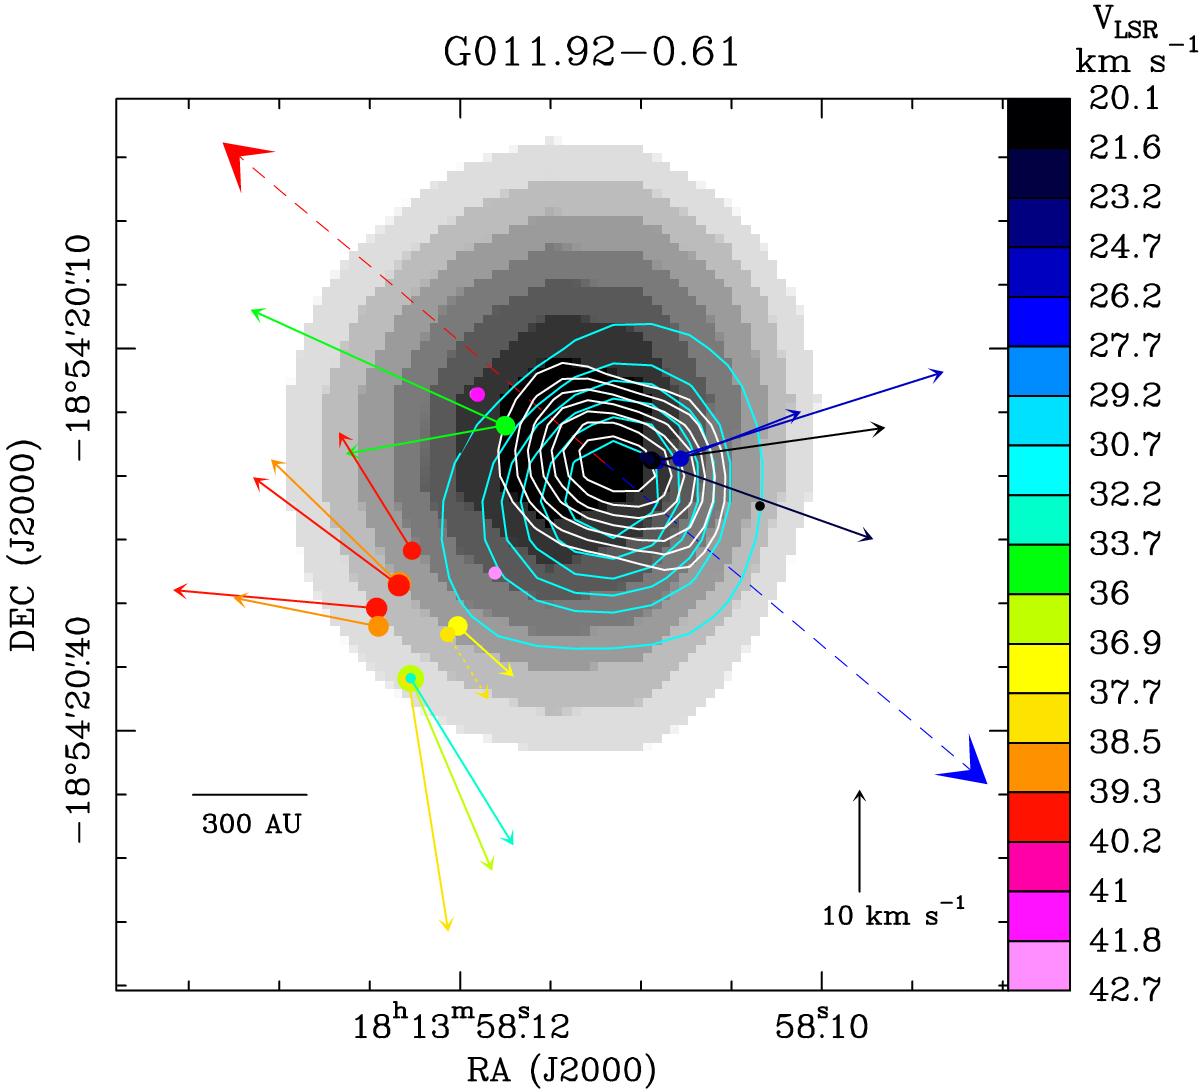
Gray-scale image: JVLA A-Array C-band continuum, using gray-tone steps that increase linearly with the map intensity from 0.055 to 0.18 mJy beam-1. The JVLA A-Array Ku-band continuum is represented with cyan contours with plotted levels −30% and from 30% to 90%, in steps of 10%, of the peak value of 0.19 mJy beam-1. The white contours reproduce the JVLA A-Array K-band continuum, plotting levels −30% and from 30% to 90%, in steps of 10%, of the peak value of 0.27 mJy beam-1. Colored dots and arrows have the same meaning as in Fig. 1. The amplitude scale for the maser velocity is indicated by the black arrow in the bottom right of the panel. The red and blue arrows indicate the direction of the red- and blue-shifted lobes, respectively, of the bipolar collimated outflow observed in the 12CO(2–1) line using the SMA by Cyganowski et al. (2011).
Current usage metrics show cumulative count of Article Views (full-text article views including HTML views, PDF and ePub downloads, according to the available data) and Abstracts Views on Vision4Press platform.
Data correspond to usage on the plateform after 2015. The current usage metrics is available 48-96 hours after online publication and is updated daily on week days.
Initial download of the metrics may take a while.