Fig. 13
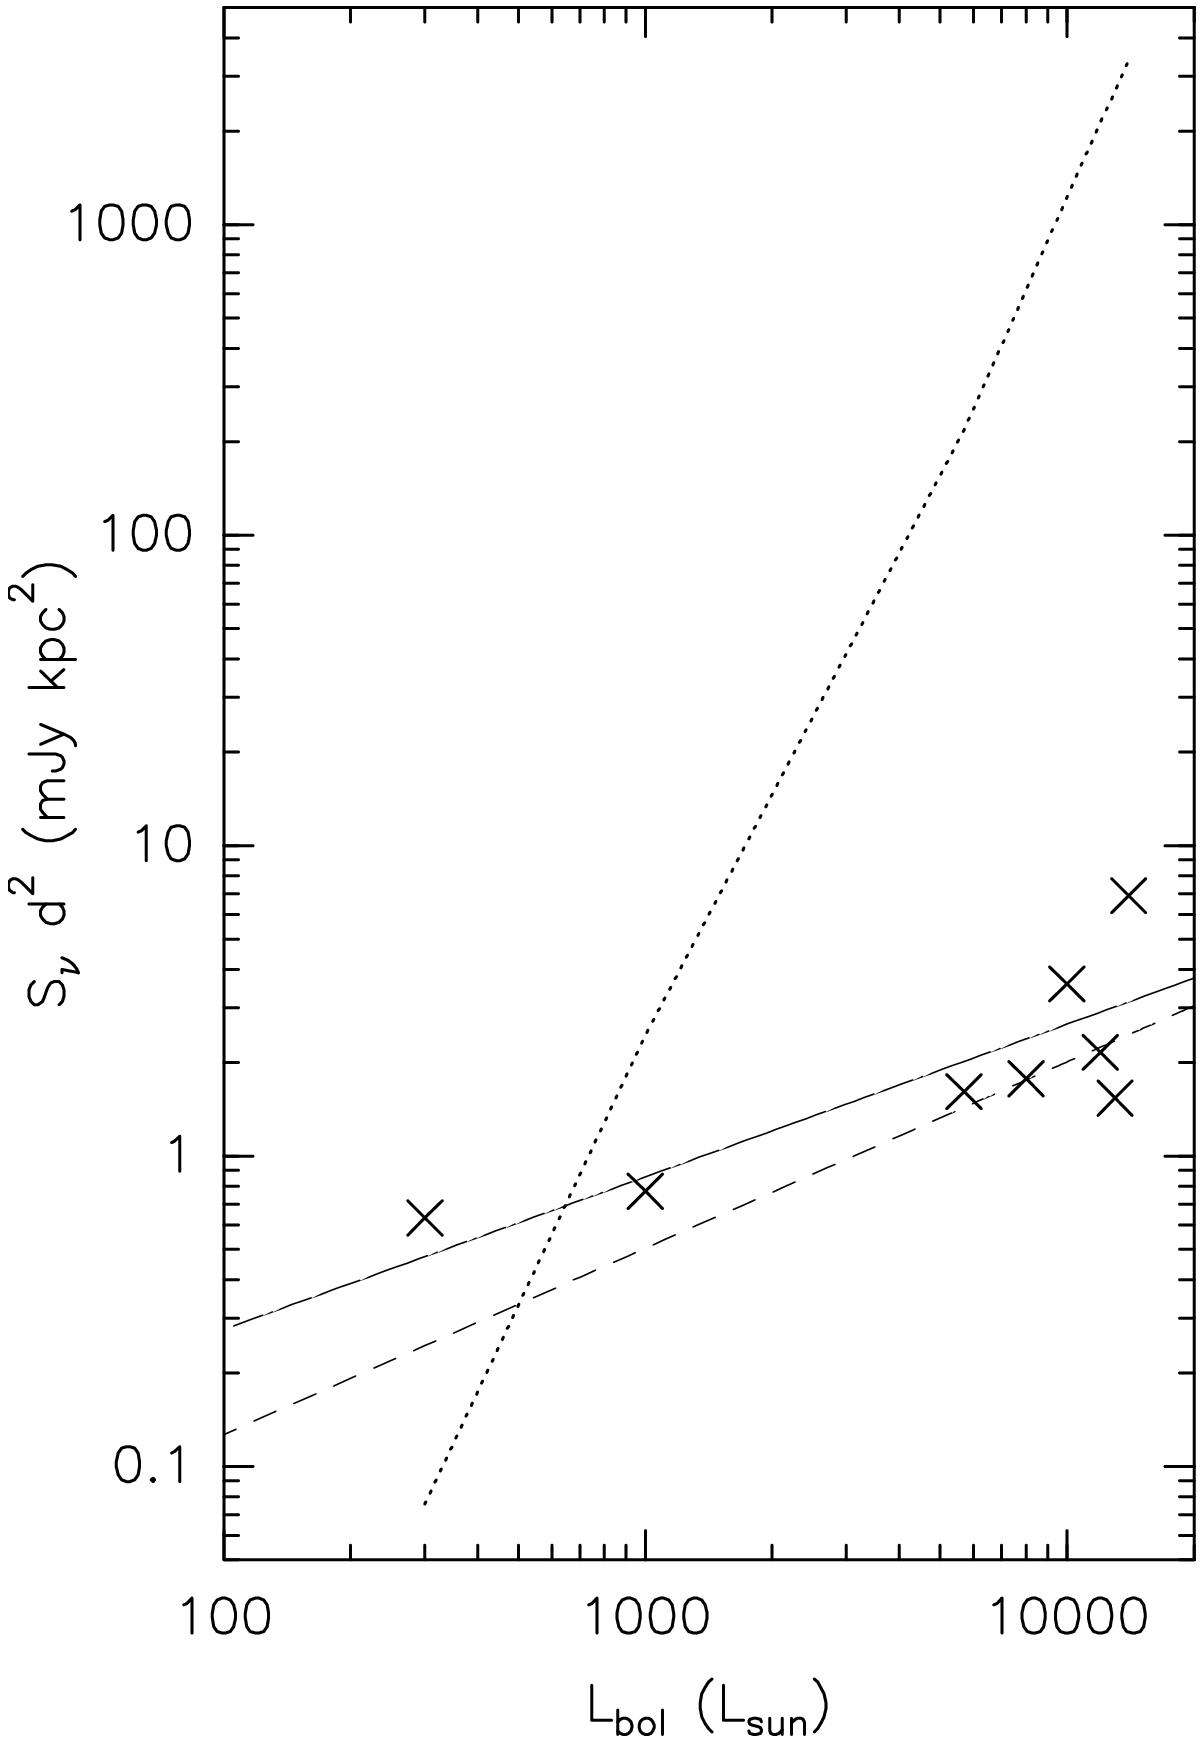
Radio continuum specific luminosity (expressed by the product of the radio flux and the square of the distance) versus the bolometric luminosity (reported in Table 1). To produce this plot we have excluded the sources G075.78+0.34 and G097.53+3.18, since the derived bolometric luminosity is probably dominated by the hyper-compact or UC Hii region observed nearby the high-mass YSO associated with the water masers. The continuous line represents the best linear fit of the logarithm of the radio and the bolometric luminosities, the dashed line gives the relation between radio and bolometric luminosities observed in low-mass YSOs (Anglada et al. 2015), and the dotted line indicates the radio luminosities expected from the Lyman continua obtained from the bolometric luminosities.
Current usage metrics show cumulative count of Article Views (full-text article views including HTML views, PDF and ePub downloads, according to the available data) and Abstracts Views on Vision4Press platform.
Data correspond to usage on the plateform after 2015. The current usage metrics is available 48-96 hours after online publication and is updated daily on week days.
Initial download of the metrics may take a while.