Fig. 12
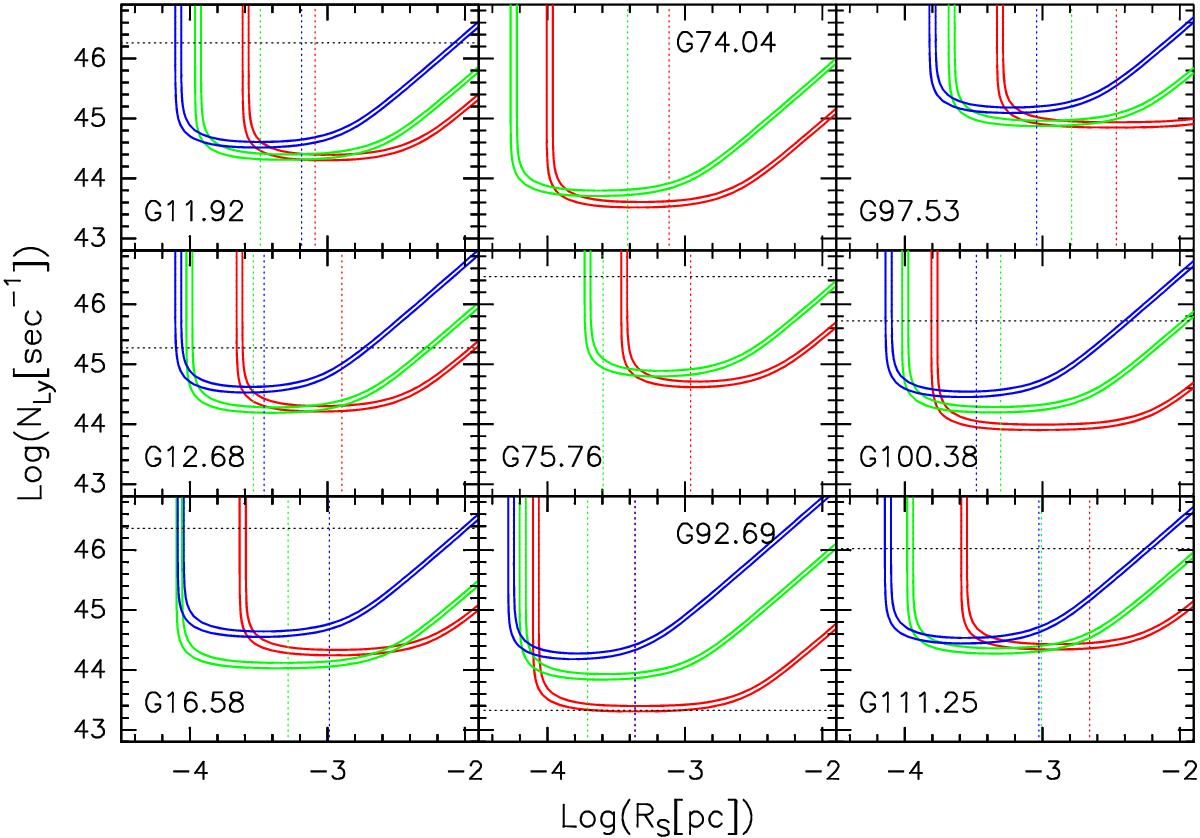
Lyman continuum photon rate, NLy, versus Strömgren radius for all the compact sources of our sample. Each curve has been obtained by fixing the peak brightness temperature in the synthesized beam to the observed value. Red, green, and blue curves correspond, respectively, to the C-, Ku-, and K-band data. Pairs of curves are drawn to allow for 10% uncertainty on the measurements. The dotted vertical lines indicate the Hii regions radii estimated at the different frequencies with the same color coding as for the curves. The horizontal dotted lines indicate the value of NLy obtained from the bolometric luminosity, assuming that only one ZAMS star is ionizing the Hii region. This is to be considered an upper limit to the effective NLy.
Current usage metrics show cumulative count of Article Views (full-text article views including HTML views, PDF and ePub downloads, according to the available data) and Abstracts Views on Vision4Press platform.
Data correspond to usage on the plateform after 2015. The current usage metrics is available 48-96 hours after online publication and is updated daily on week days.
Initial download of the metrics may take a while.