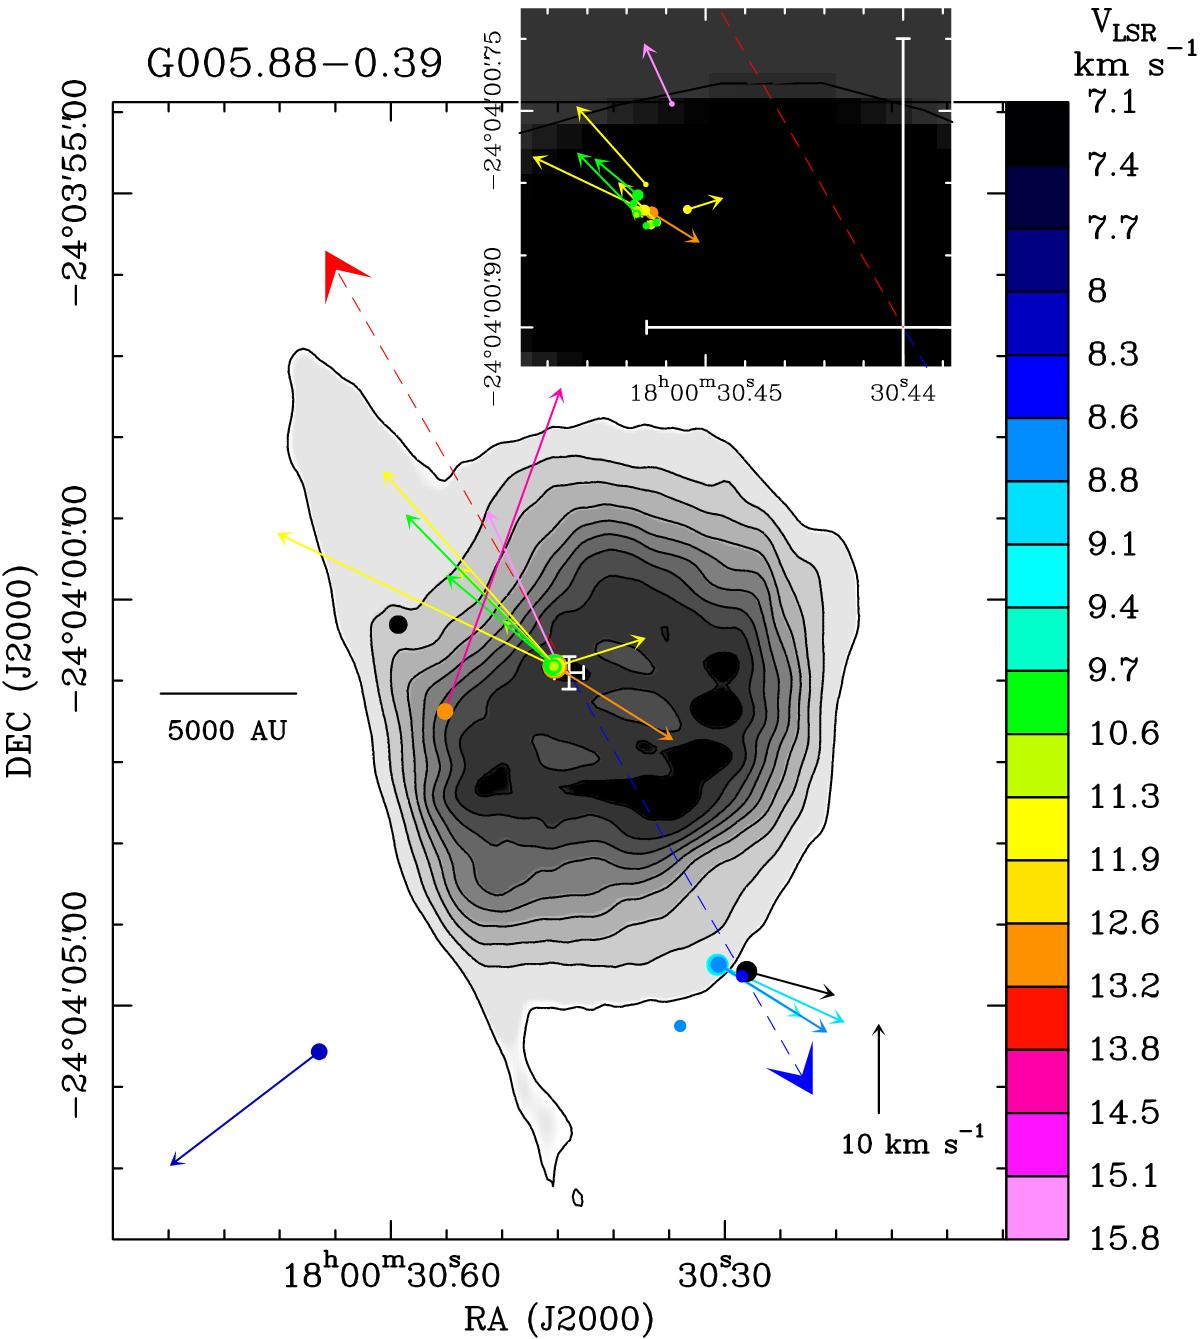
Fig. 1

Gray-scale image and contours: JVLA A-Array C-band continuum, using gray-tone steps that increase linearly with the map intensity from 8 mJy beam-1 to the peak emission of 82 mJy beam-1, and contours corresponding to 10% to 90%, in steps of 10%, of the peak emission. The extended Ku-band emission is totally resolved out by our JVLA A-Array observations, and this source was not observed in the K-band by the JVLA. Colored dots show the absolute position of individual maser features, with color denoting the maser VLSR, according to the color-velocity conversion code reported on the right side of the panel. The green color gives the systemic VLSR, derived through (single-dish and/or interferometric) observations in high-density, thermal tracers. Dot area is proportional to the logarithm of the maser intensity. Colored arrows represent the measured maser proper motions, with dotted arrows used to represent the most uncertain proper motions. The amplitude scale for the maser velocity is indicated by the black arrow in the bottom right of the panel. The white errorbars denote the position (with the associated error) of the bright star detected in the near-infrared with the VLT by Feldt et al. (2003), and the red and blue arrows indicate the direction of the red- and blue-shifted lobes, respectively, of the bipolar collimated outflow observed in the SiO(5–4) line using the SMA by Sollins et al. (2004). The inset in the top right of the panel shows an enlargement of the clustered maser emission region close to the near-infrared star.
Current usage metrics show cumulative count of Article Views (full-text article views including HTML views, PDF and ePub downloads, according to the available data) and Abstracts Views on Vision4Press platform.
Data correspond to usage on the plateform after 2015. The current usage metrics is available 48-96 hours after online publication and is updated daily on week days.
Initial download of the metrics may take a while.


