Fig. 8
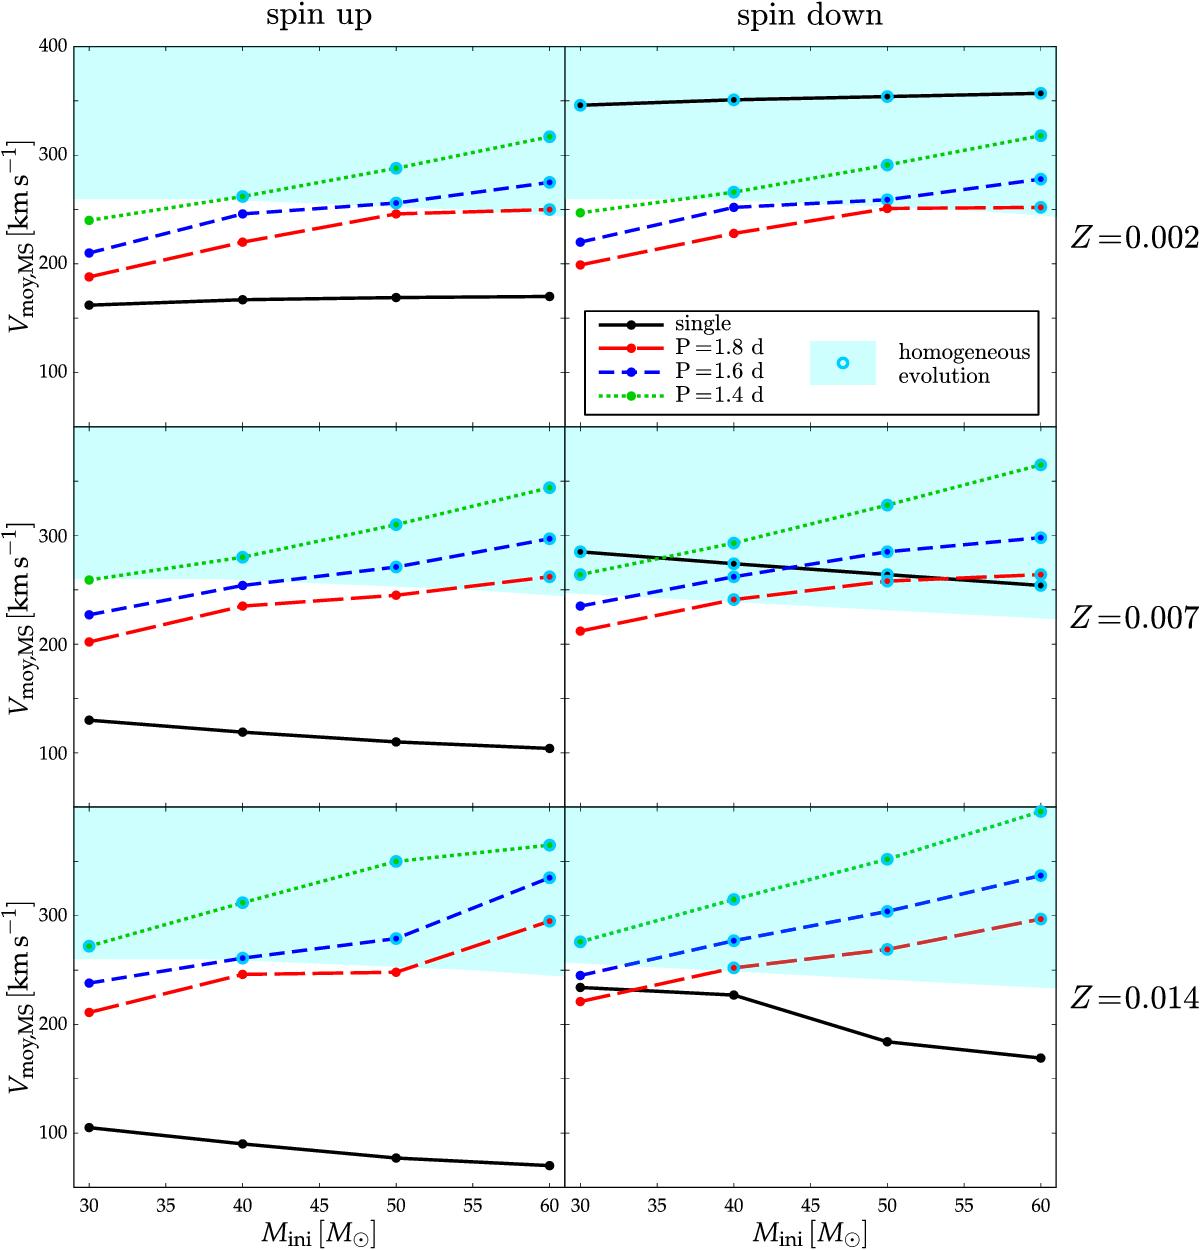
Time-averaged surface equatorial velocity of single and binary stars as a function of the initial mass for various metallicities. The colour code for the lines is the same as in Fig. 7. The initial period in days is indicated. The results correspond to a companion having 2/3 the mass of the primary. The (cyan) big dots show the models that follow a homogeneous evolution. The cyan shading indicates the zone where homogeneous models lie in this diagram. The panels in the left column correspond to spin-down cases and the panels in the right column to spin-up cases.
Current usage metrics show cumulative count of Article Views (full-text article views including HTML views, PDF and ePub downloads, according to the available data) and Abstracts Views on Vision4Press platform.
Data correspond to usage on the plateform after 2015. The current usage metrics is available 48-96 hours after online publication and is updated daily on week days.
Initial download of the metrics may take a while.