Fig. B.4
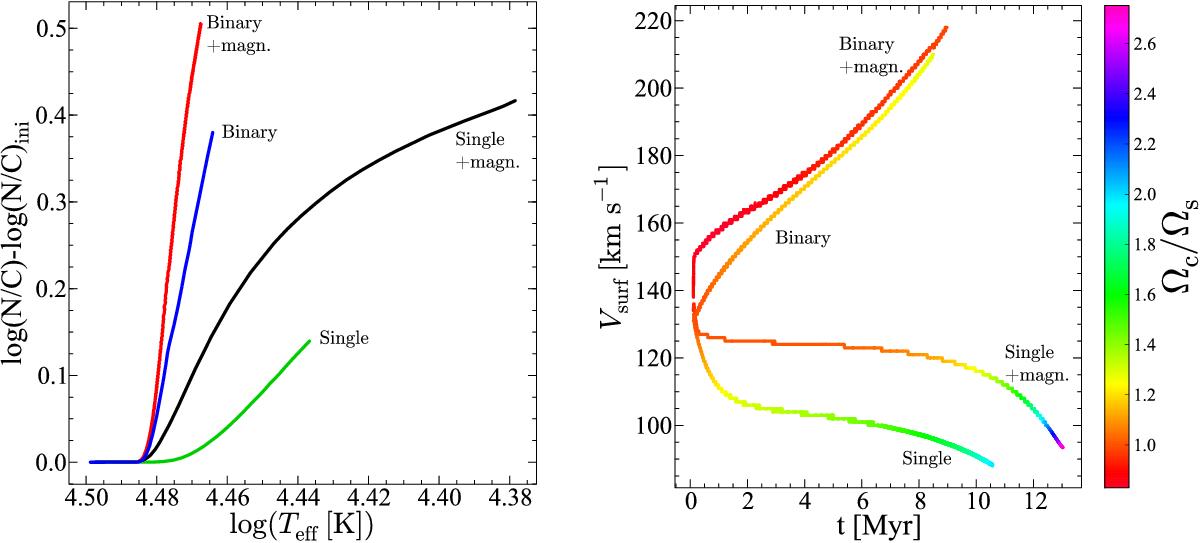
Left panel: evolution of the abundance ratio N/C at the surface of 15 M⊙ models at Z = 0.014 with an initial equatorial velocity of ~135 km s-1 as a function of lgTeff. Binary models correspond to 15 M⊙ with the same characteristics as indicated above but with a 10 M⊙ companion and an initial orbital period of 1.4 days. Right panel: evolution of the surface equatorial velocity as a function of time for the same models as in the left panel. The colours indicate the ratio between the central angular velocity and the surface velocity.
Current usage metrics show cumulative count of Article Views (full-text article views including HTML views, PDF and ePub downloads, according to the available data) and Abstracts Views on Vision4Press platform.
Data correspond to usage on the plateform after 2015. The current usage metrics is available 48-96 hours after online publication and is updated daily on week days.
Initial download of the metrics may take a while.