Fig. 1
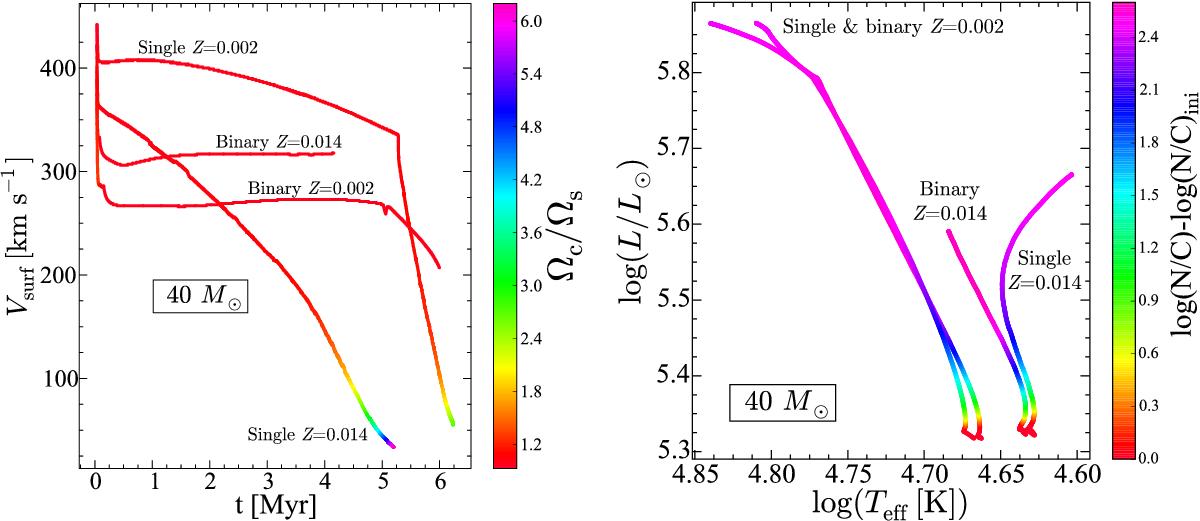
Left panel: evolution of the surface equatorial velocity as a function of time for 40 M⊙ models. The colours indicate the ratio between the central and surface angular velocities. The orbital period for the binary model is 1.4 days, the secondary model has an initial mass equal to 26.7 M⊙. Right panel: evolutionary tracks in the HRD for the same models as in the left panel. The colours indicate the N/C ratio at the surface normalised to the initial one (N/Cini = 0.29 in mass fraction). In the binary systems, the stars initially have an angular velocity superior to the orbital velocity, and thus the tidal forces spin down the star (see Table A.1).
Current usage metrics show cumulative count of Article Views (full-text article views including HTML views, PDF and ePub downloads, according to the available data) and Abstracts Views on Vision4Press platform.
Data correspond to usage on the plateform after 2015. The current usage metrics is available 48-96 hours after online publication and is updated daily on week days.
Initial download of the metrics may take a while.