Fig. 5
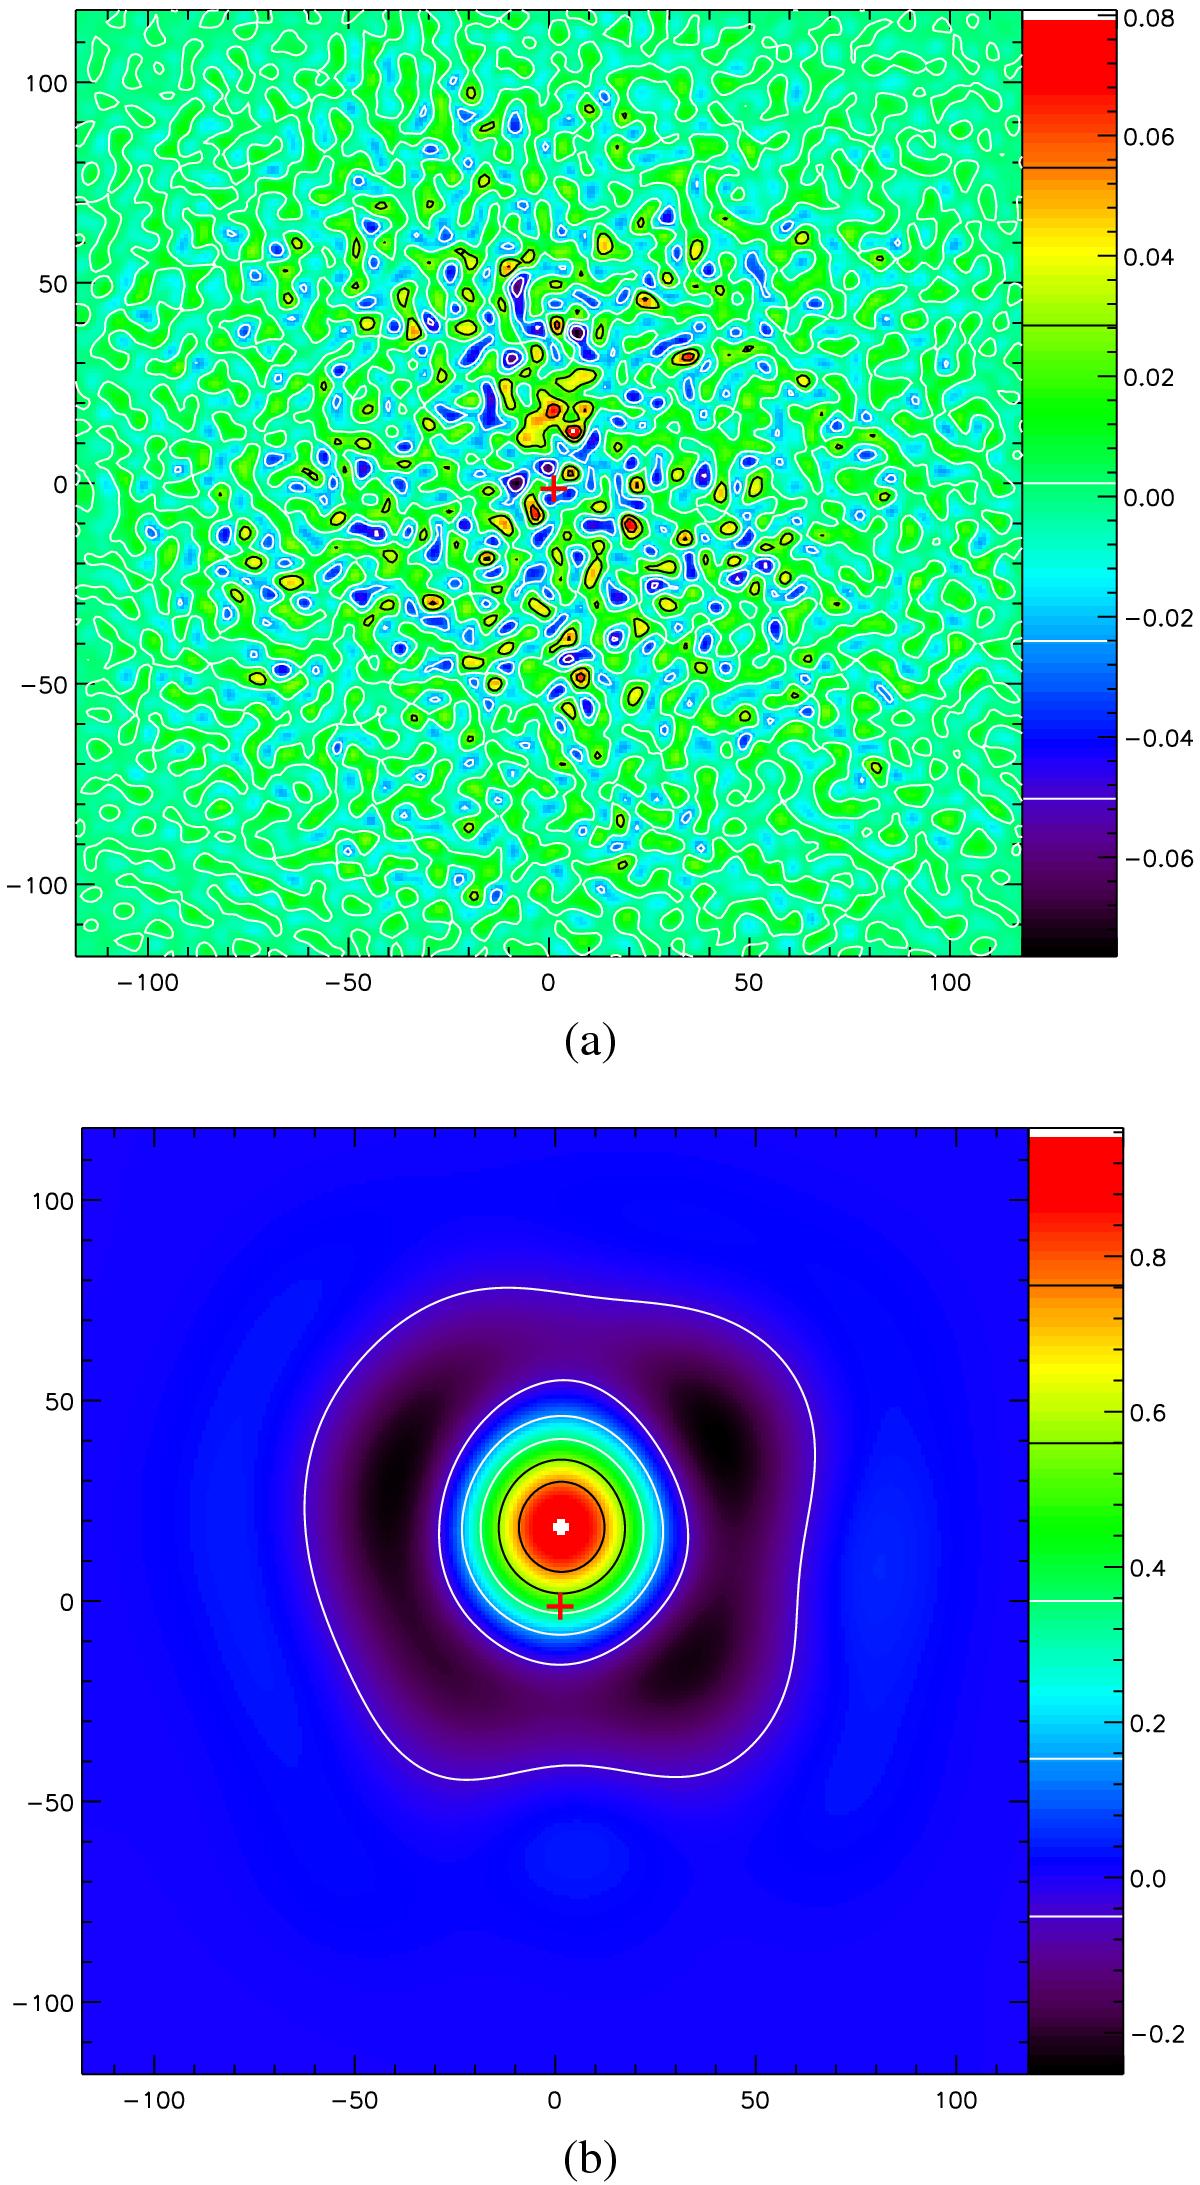
Cross-correlation functions for the pairs of wavelet-filtered maps from Fig. 2. Top panel: Cw(t,5 pix), bottom panel: Cw(t,45pix). The red crosses denote the centre of the offset plane t = 0, where one can read the wavelet cross-correlation coefficient r(l) = Cw(t = 0,l). The peak of the cross-correlation functions is displaced from the centre by τ(l) = τi as the WWCC recovers the input displacement of the structure in the second map.
Current usage metrics show cumulative count of Article Views (full-text article views including HTML views, PDF and ePub downloads, according to the available data) and Abstracts Views on Vision4Press platform.
Data correspond to usage on the plateform after 2015. The current usage metrics is available 48-96 hours after online publication and is updated daily on week days.
Initial download of the metrics may take a while.