Fig. A.2
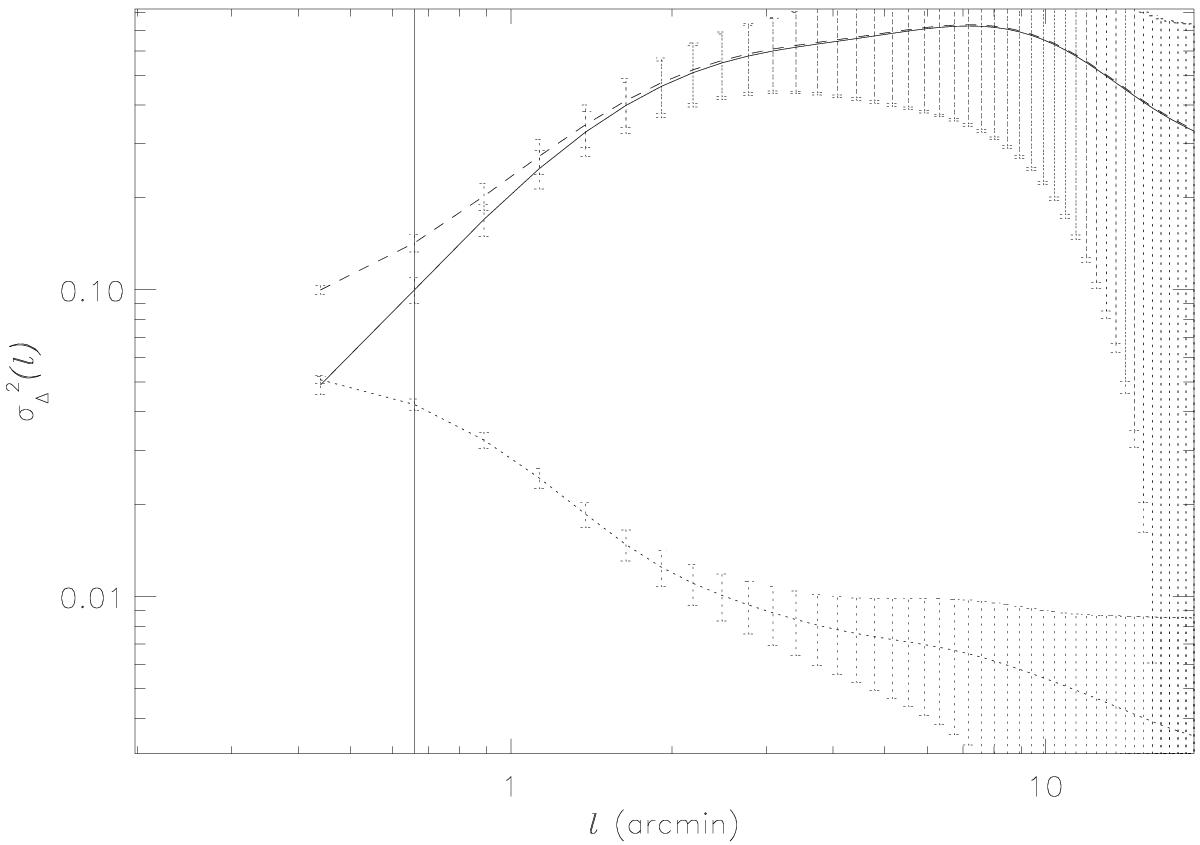
Δ-variance of the observed C18O emission line map (dashed line) and the noise emission across the C18O map in Fig. A.1 (dotted line). Their difference represents a pure Δ-variance free of the noise effect (full line). The vertical line denotes the critical scale lc = 0.66 arcmin at which the pure Δ-variance curve is the steepest. 1σ error bars are presented.
Current usage metrics show cumulative count of Article Views (full-text article views including HTML views, PDF and ePub downloads, according to the available data) and Abstracts Views on Vision4Press platform.
Data correspond to usage on the plateform after 2015. The current usage metrics is available 48-96 hours after online publication and is updated daily on week days.
Initial download of the metrics may take a while.