Fig. 39
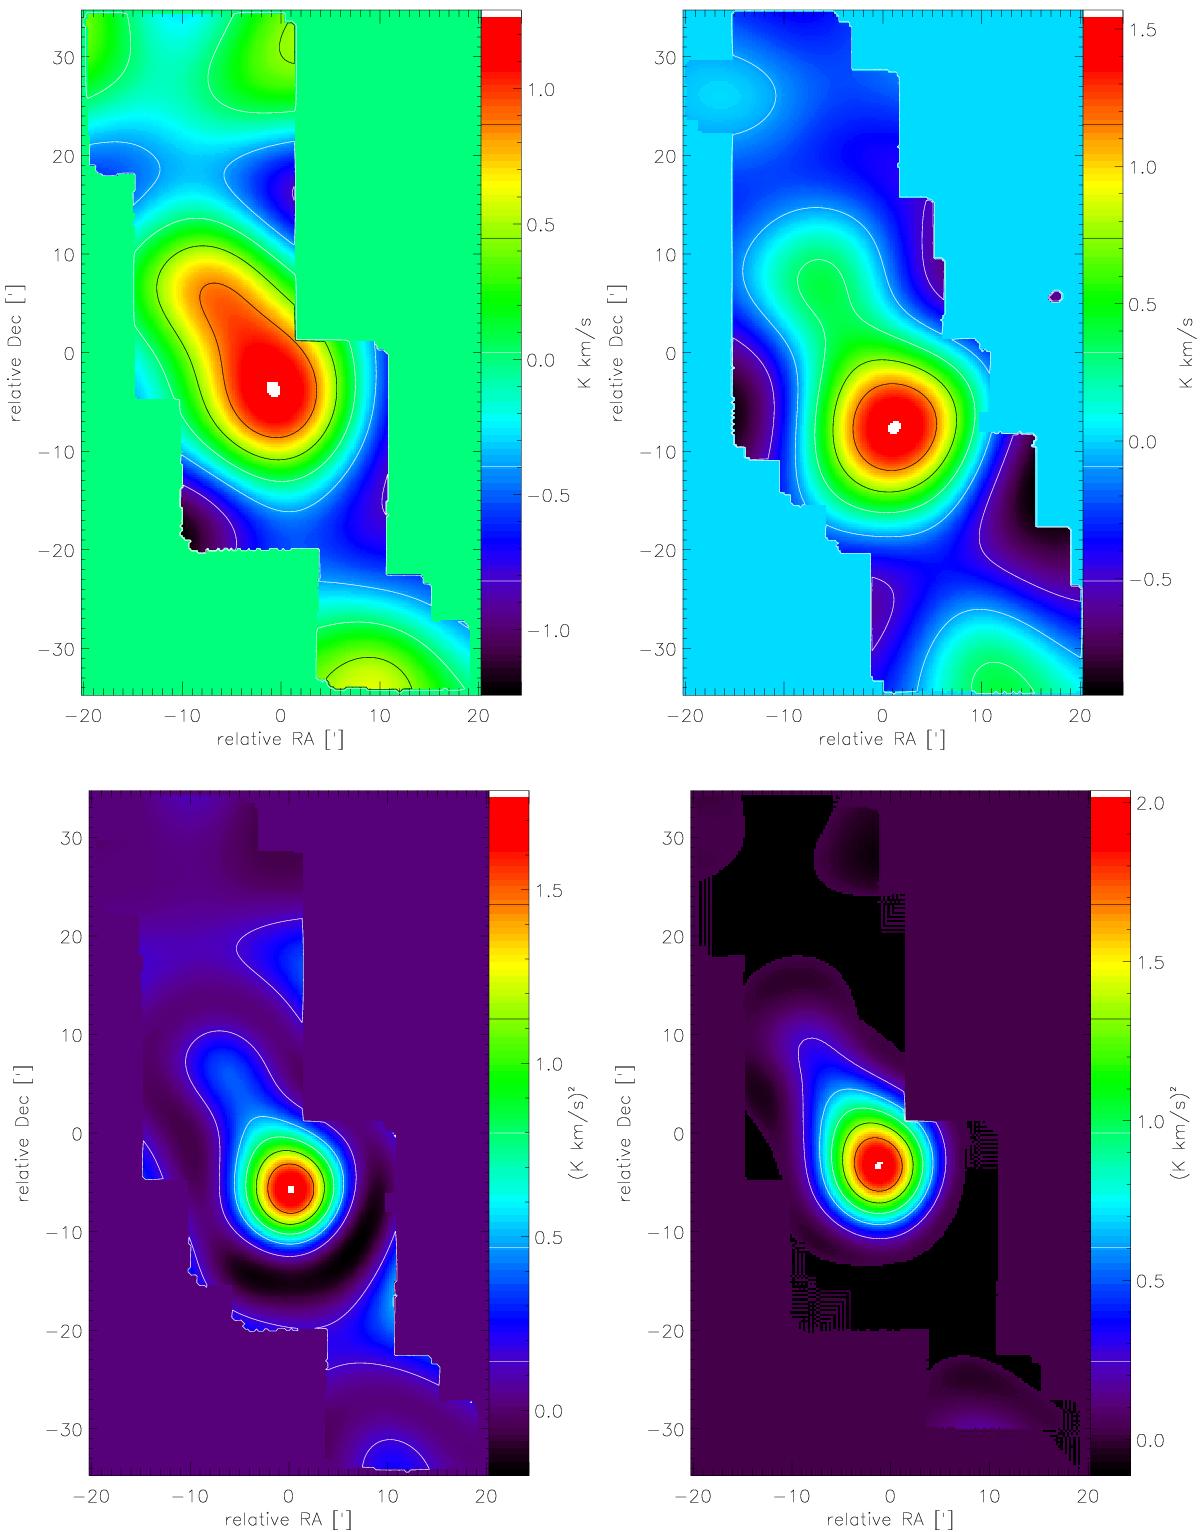
Top panels: integrated intensity maps of C18O and HCN emission lines wavelet-filtered on scale of l = 18 arcmin (left and right panels, respectively). Bottom left: product map generated by multiplying the two wavelet-filtered maps (top panels). Bottom right: shifted product map of the top left and top right maps where the latter one is shifted by measured offset in the north-east direction (τx = −2.8 arcmin and τy = 4.5 arcmin). Note the increase of the signal for the shifted combination compared to the direct product.
Current usage metrics show cumulative count of Article Views (full-text article views including HTML views, PDF and ePub downloads, according to the available data) and Abstracts Views on Vision4Press platform.
Data correspond to usage on the plateform after 2015. The current usage metrics is available 48-96 hours after online publication and is updated daily on week days.
Initial download of the metrics may take a while.